Overview
This guide covers the live data collection and plotting workflow in Trigno Discover 2.0. You will learn how to start a trial, scale and navigate signal views, use event markers, and export collected data efficiently. The step-by-step instructions also cover customizing plotting windows, adjusting axes behaviors, and configuring follow-up trials. These features help streamline your recording sessions and improve post-trial analysis. For a visual walkthrough, please refer to the Trigno Discover video tutorials on Data Collection and Review.
Information
This article refers to Trigno Discover version 2.0.1. Please note that the user interface may vary depending on the version you have installed. You can find your current version of Trigno Discover in the top left corner of the application window.
Trigno Discover Getting Started Video Tutorial: Data Collection & Review
System Requirements
Material/Tool | Description |
|---|---|
Software | Trigno Discover 2.0 + |
Hardware: System | Trigno Centro; Trigno Lite; Trigno Research Base Station |
Firmware: System | Trigno Centro: 06-05-00 | 04-01 + Trigno Lite: 02-02 + Trigno Research Base Station: Digital: 2919 | 1506 | 0806 | 2008 | 0000 Analog: 2919| 1506 | 0806 | 2008| 0901 |
Hardware: Sensors | Avanti-Style Sensors |
Firmware: Sensors | Avanti-Style Sensor: 40-49 Maize Sensor: 60-29 |
Operating System | Windows 11 |
PC Specifications |
|
Step-by-Step Instructions
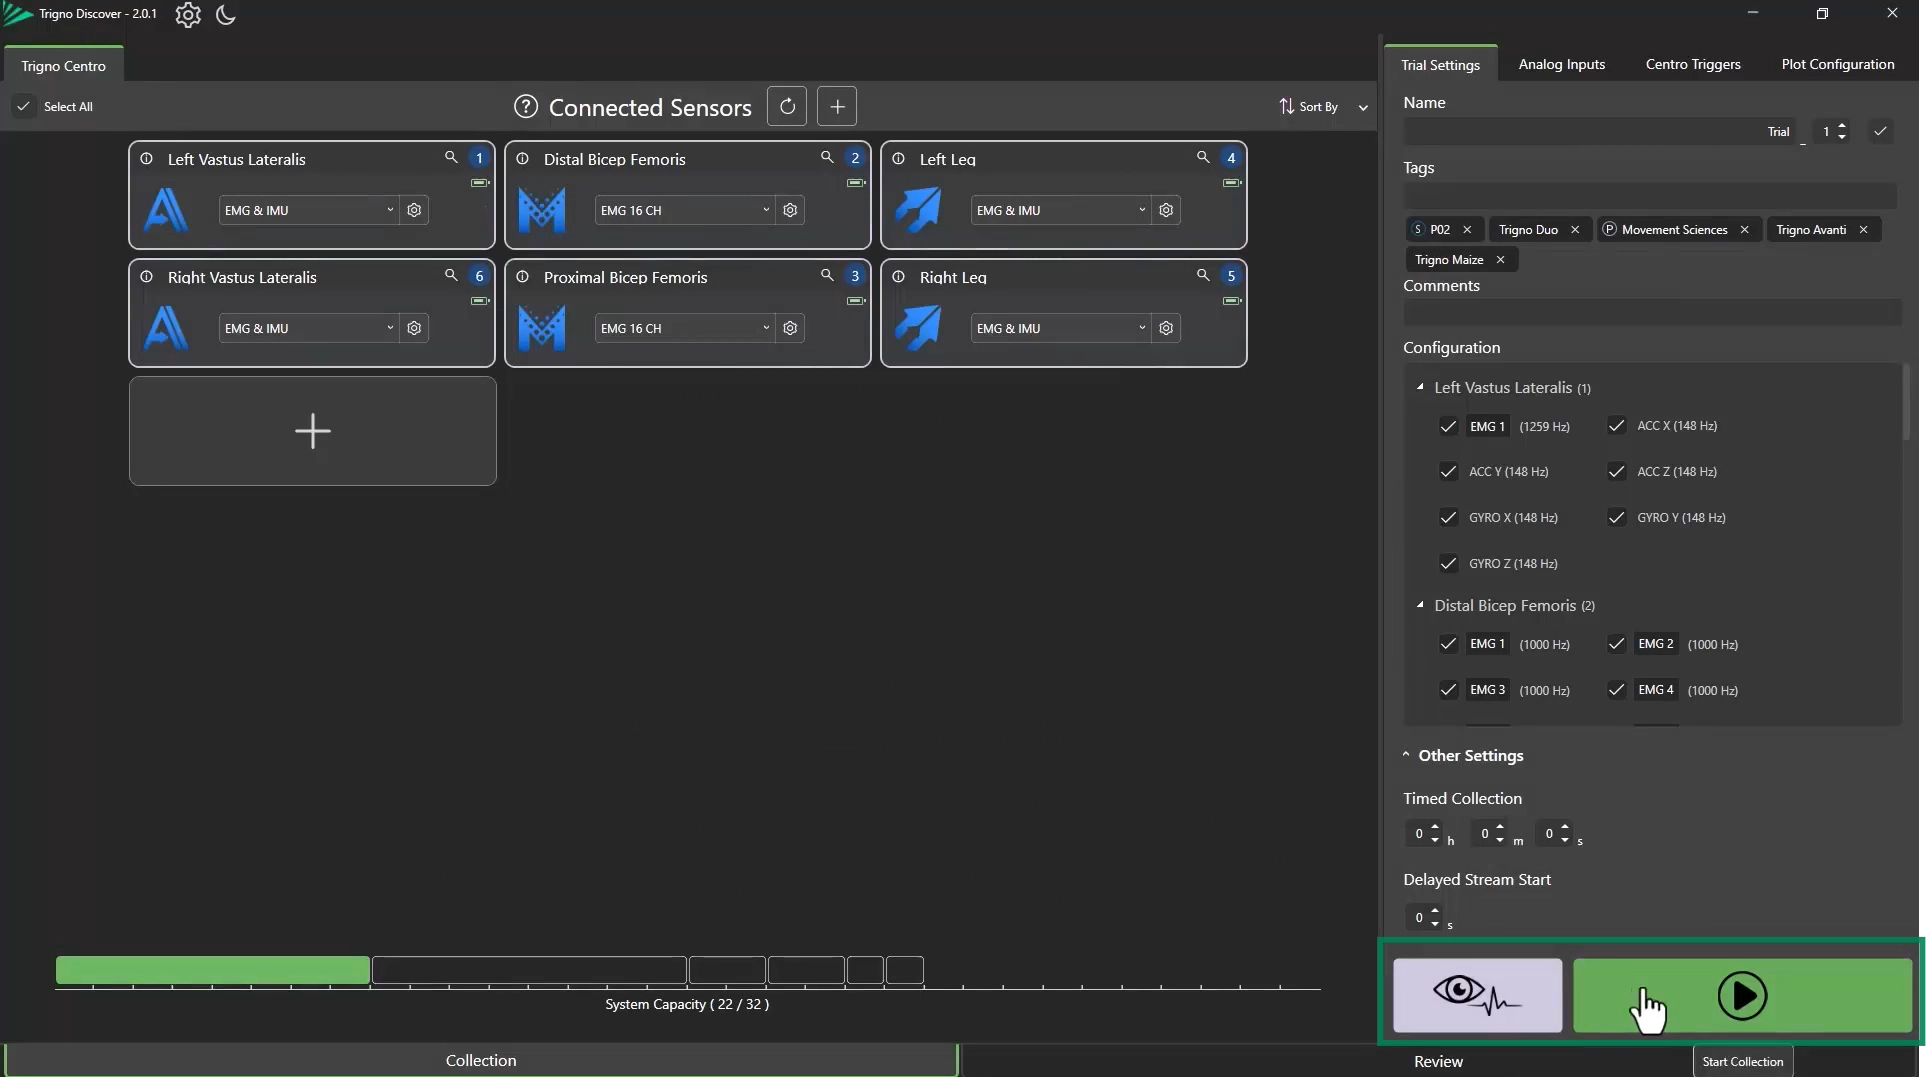
Step 1: Begin Data Collection
Configure Sensors
Ensure sensors are properly configured (See Trigno Discover: Trial Set-up article).
Start Data Collection
To check signal quality before recording, select “ Preview Signal”.
Previewing does not save any data.
Click “Start Collection” to begin streaming data in real-time.
Step 2: Adjusting Y-Axis View
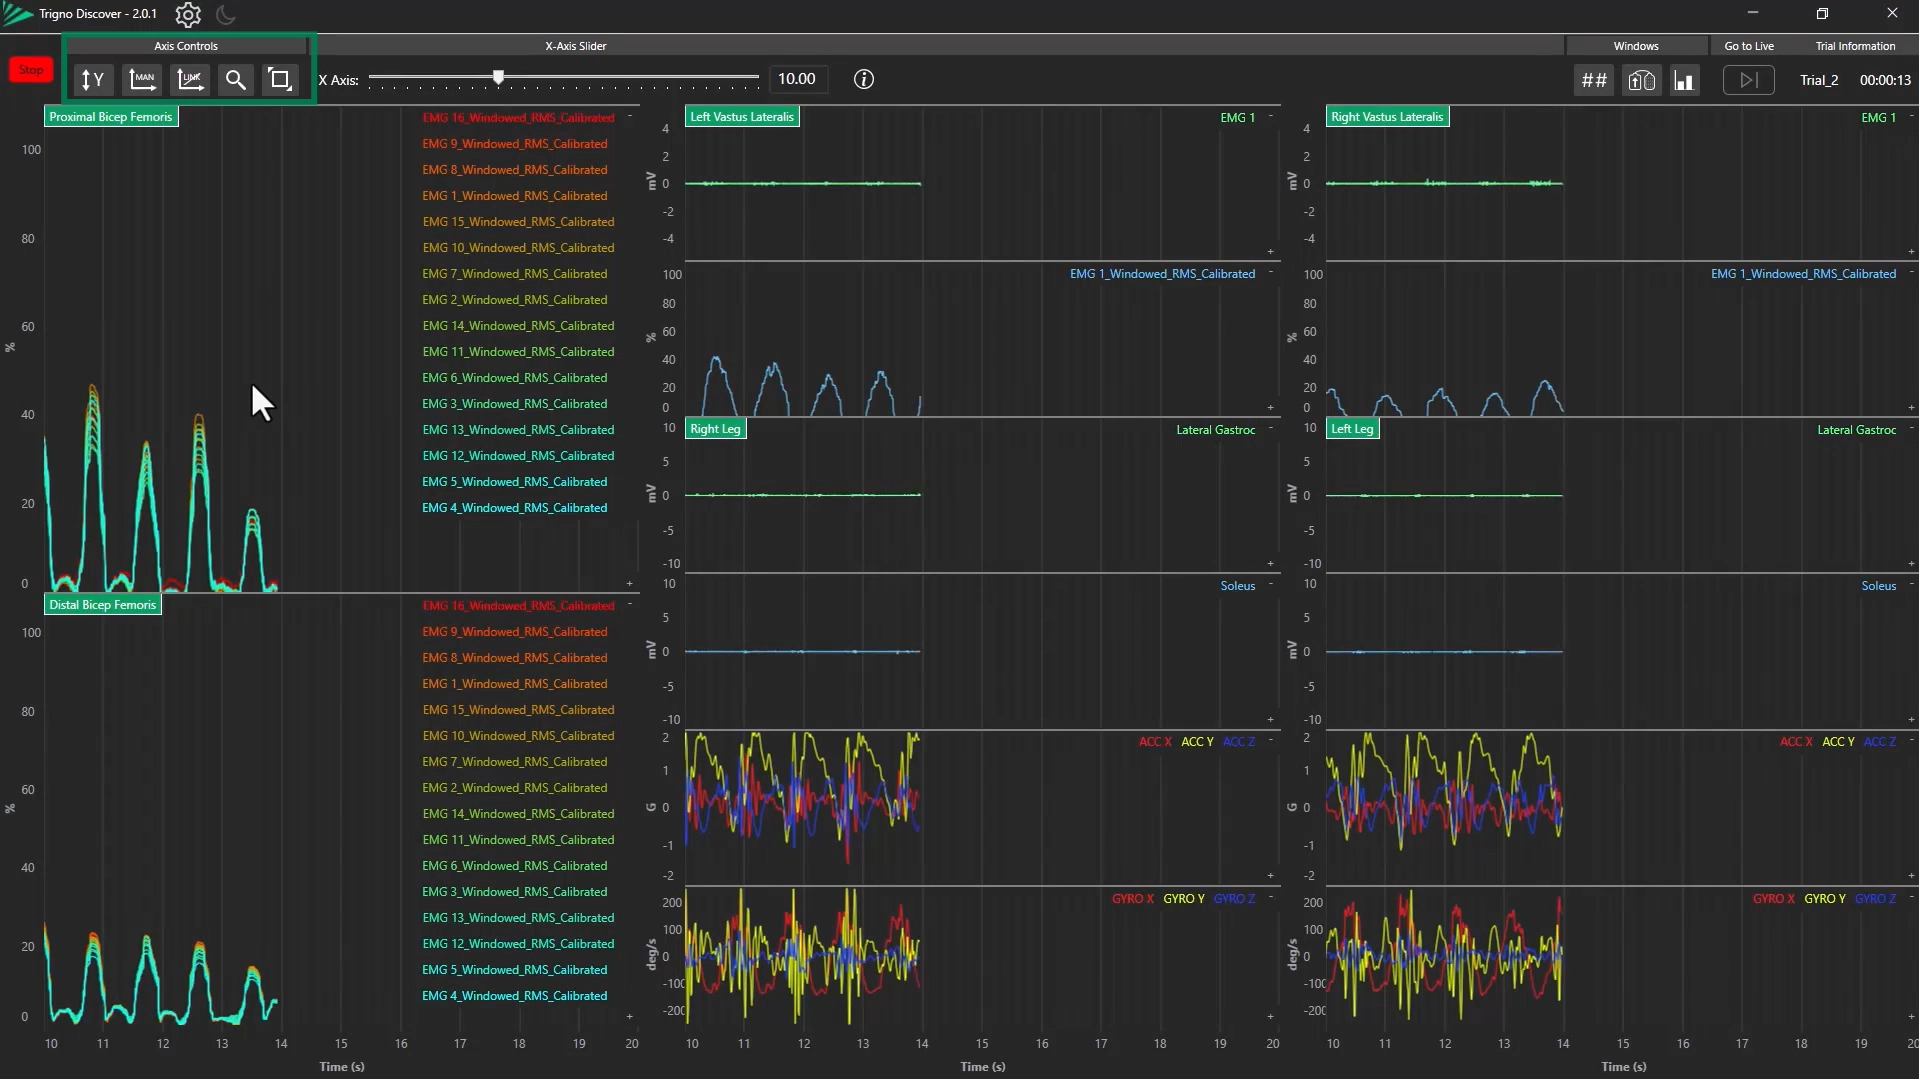
View Full Y-Axis Range
Click the “Go to Y Bounds” button to set the Y-axis to display the full data range.
Adjust Y-Axis Scaling
Toggle “Auto Scale” to automatically scale Y-axis.
Toggle “Link Axis” to synchronize the Y-axis across channels of the same data type.
Zoom and Pan on Y-Axis
Click and drag the Y-axis to zoom or pan an individual channel.
Use the Y-axis behavior toggle to switch between zooming and panning modes.
Step 3: Customiszing Plotting Window
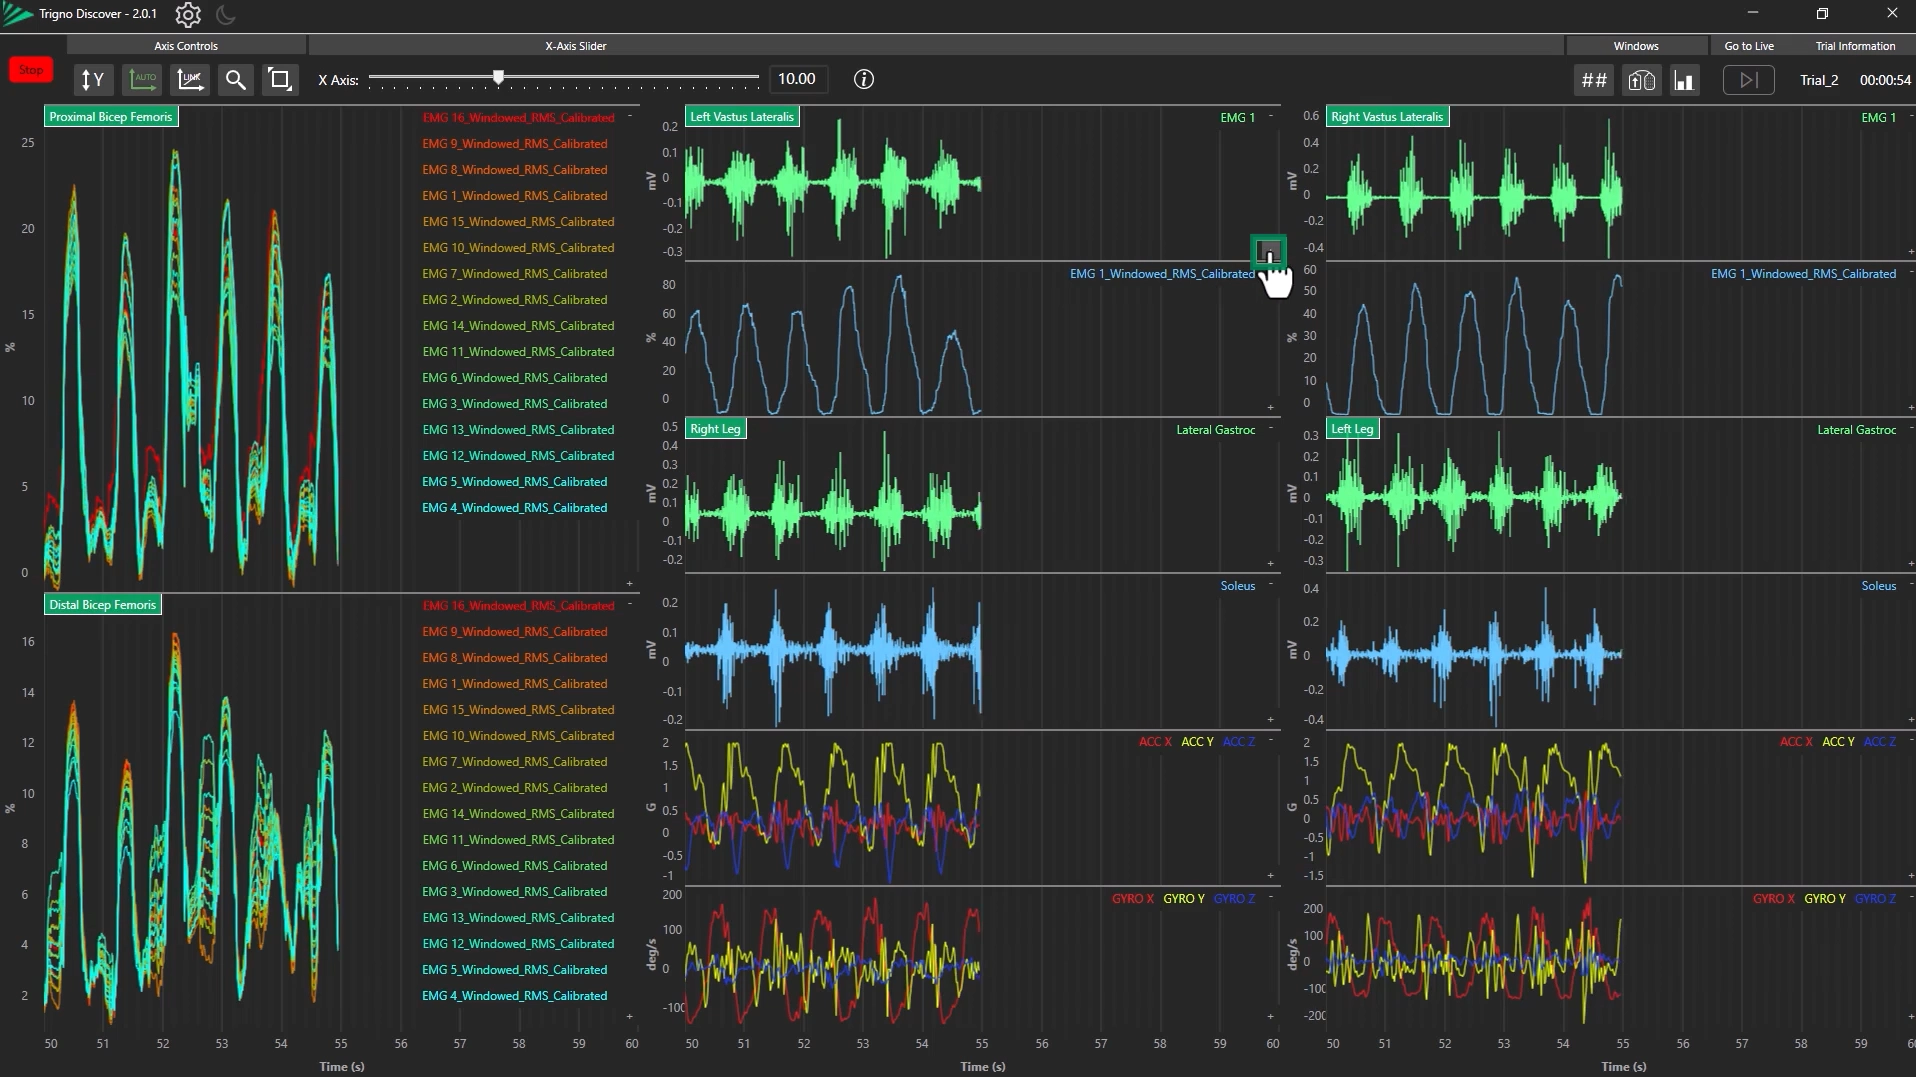
Expand Plot Window
Click the “+” button on a channel, then select the “Expand” icon to maximize the plotting window.
Collapse Plot Window
Click the “Expand” icon again to collapse the plotting window back.
Step 3: Adjusting the X-Axis
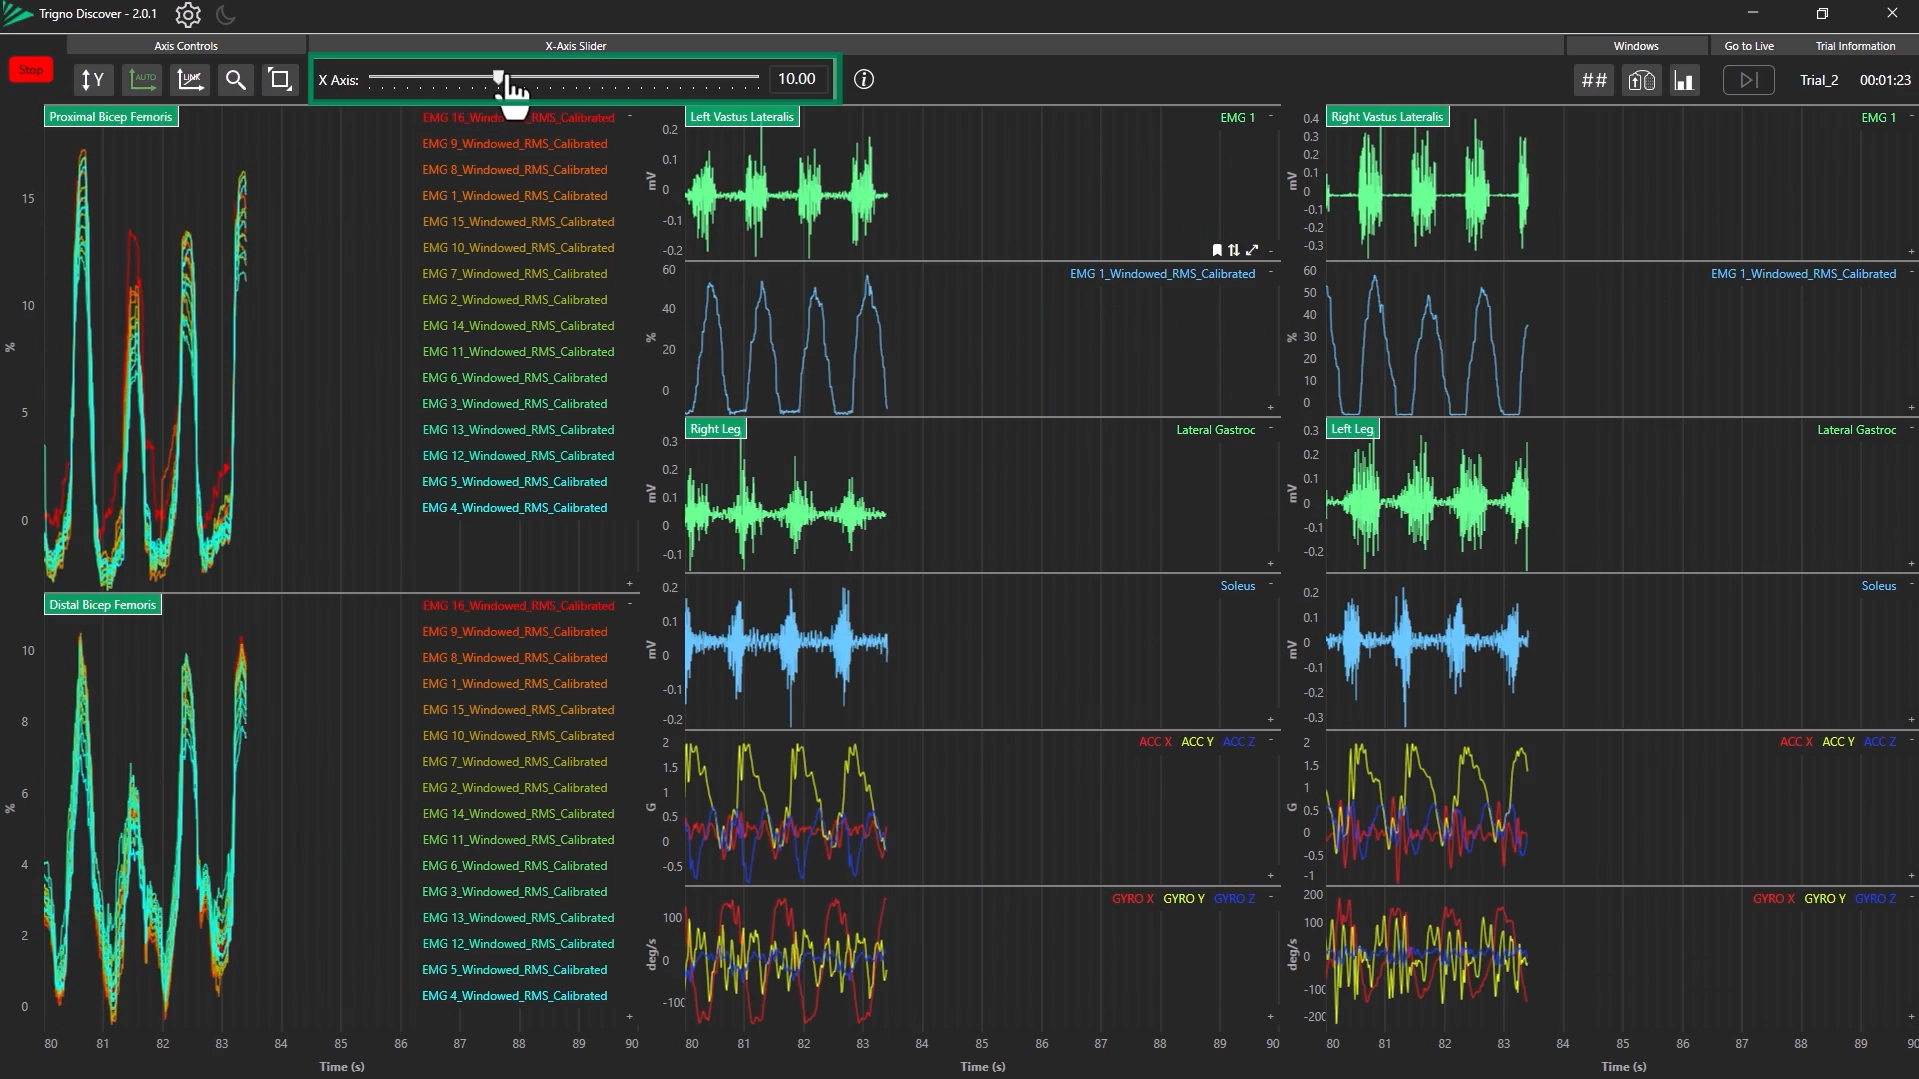
Change X-Axis Scale
Adjust manually using the sliding scale or type in a value.
Zoom In/Out on X-Axis
Use the mouse scroll wheel to zoom in and out on the time axis.
Pan Across Time
Left-click and drag within the data window to quickly pan.
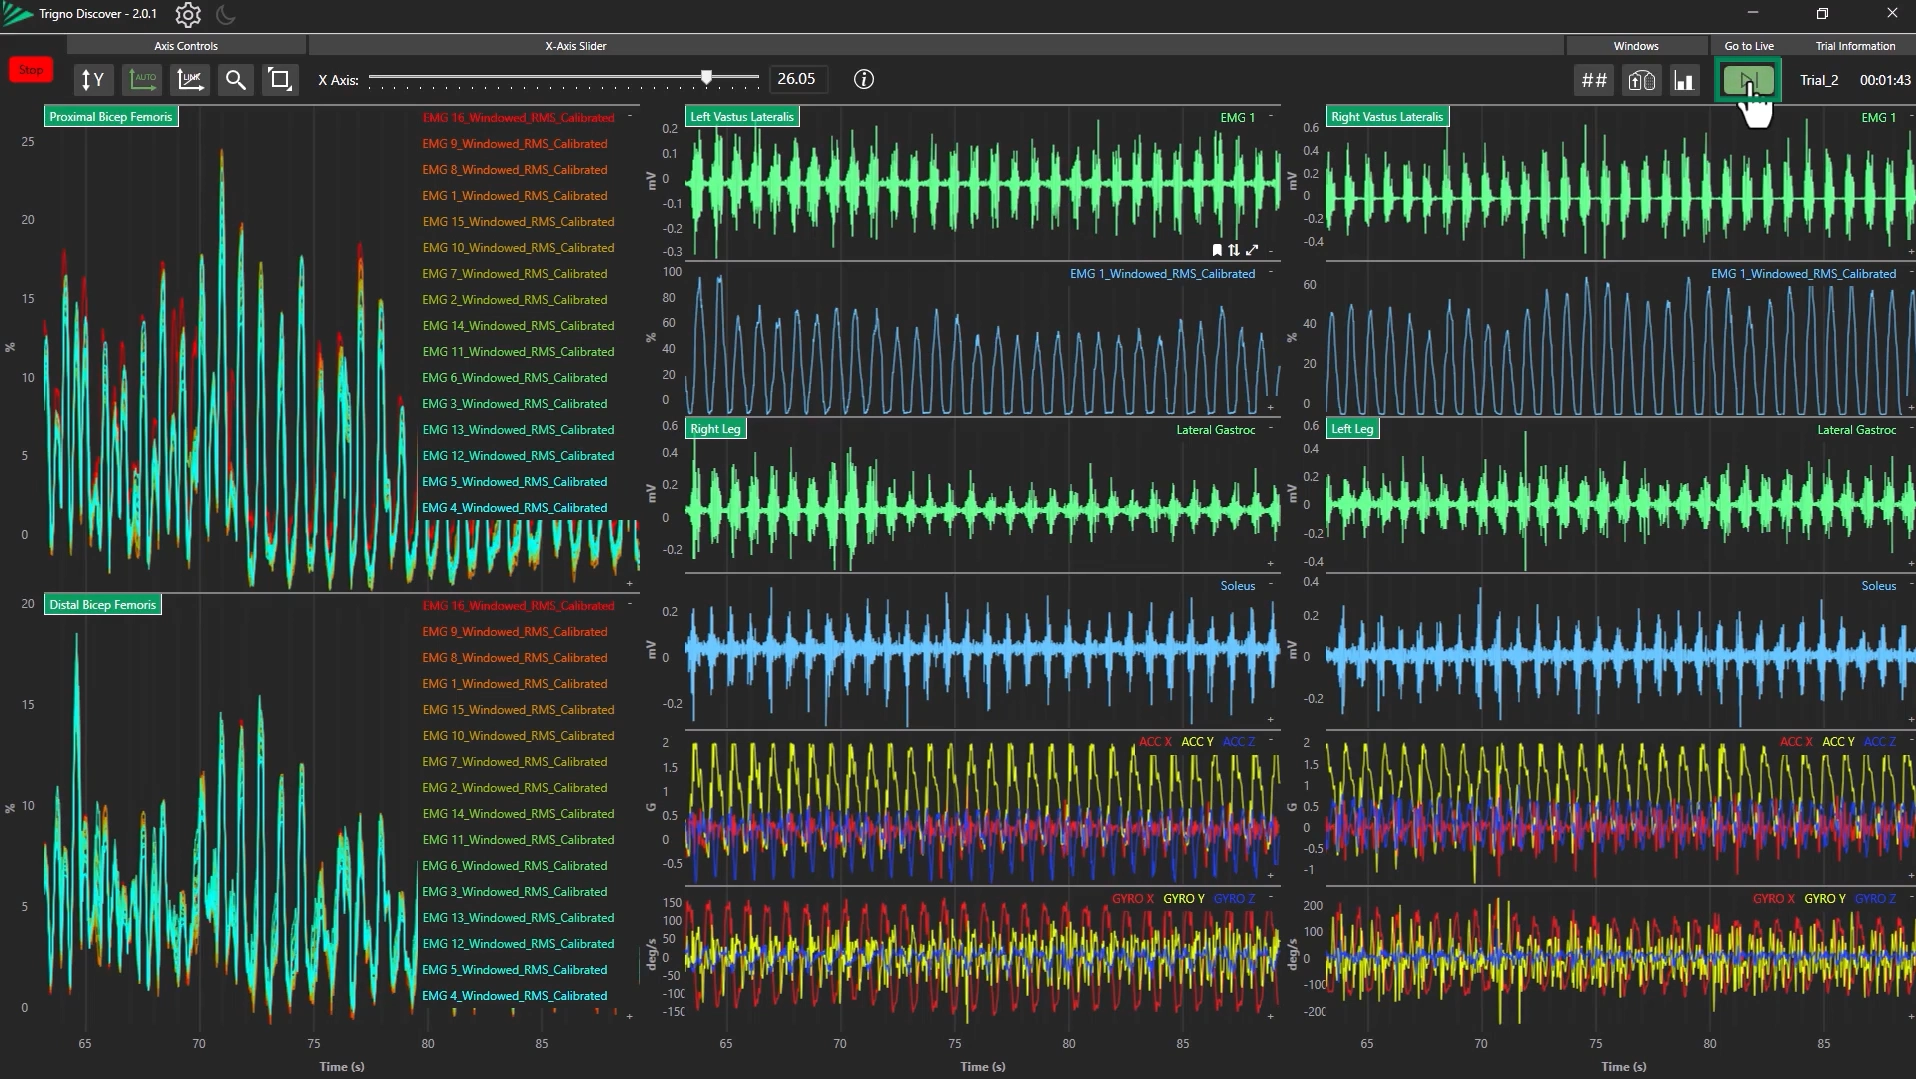
Returning to Real-Time View
Click the “Go to Live Trace” button or press the F2 key to return to real-time plotting.
Step 4: Customizing Plotting Windows
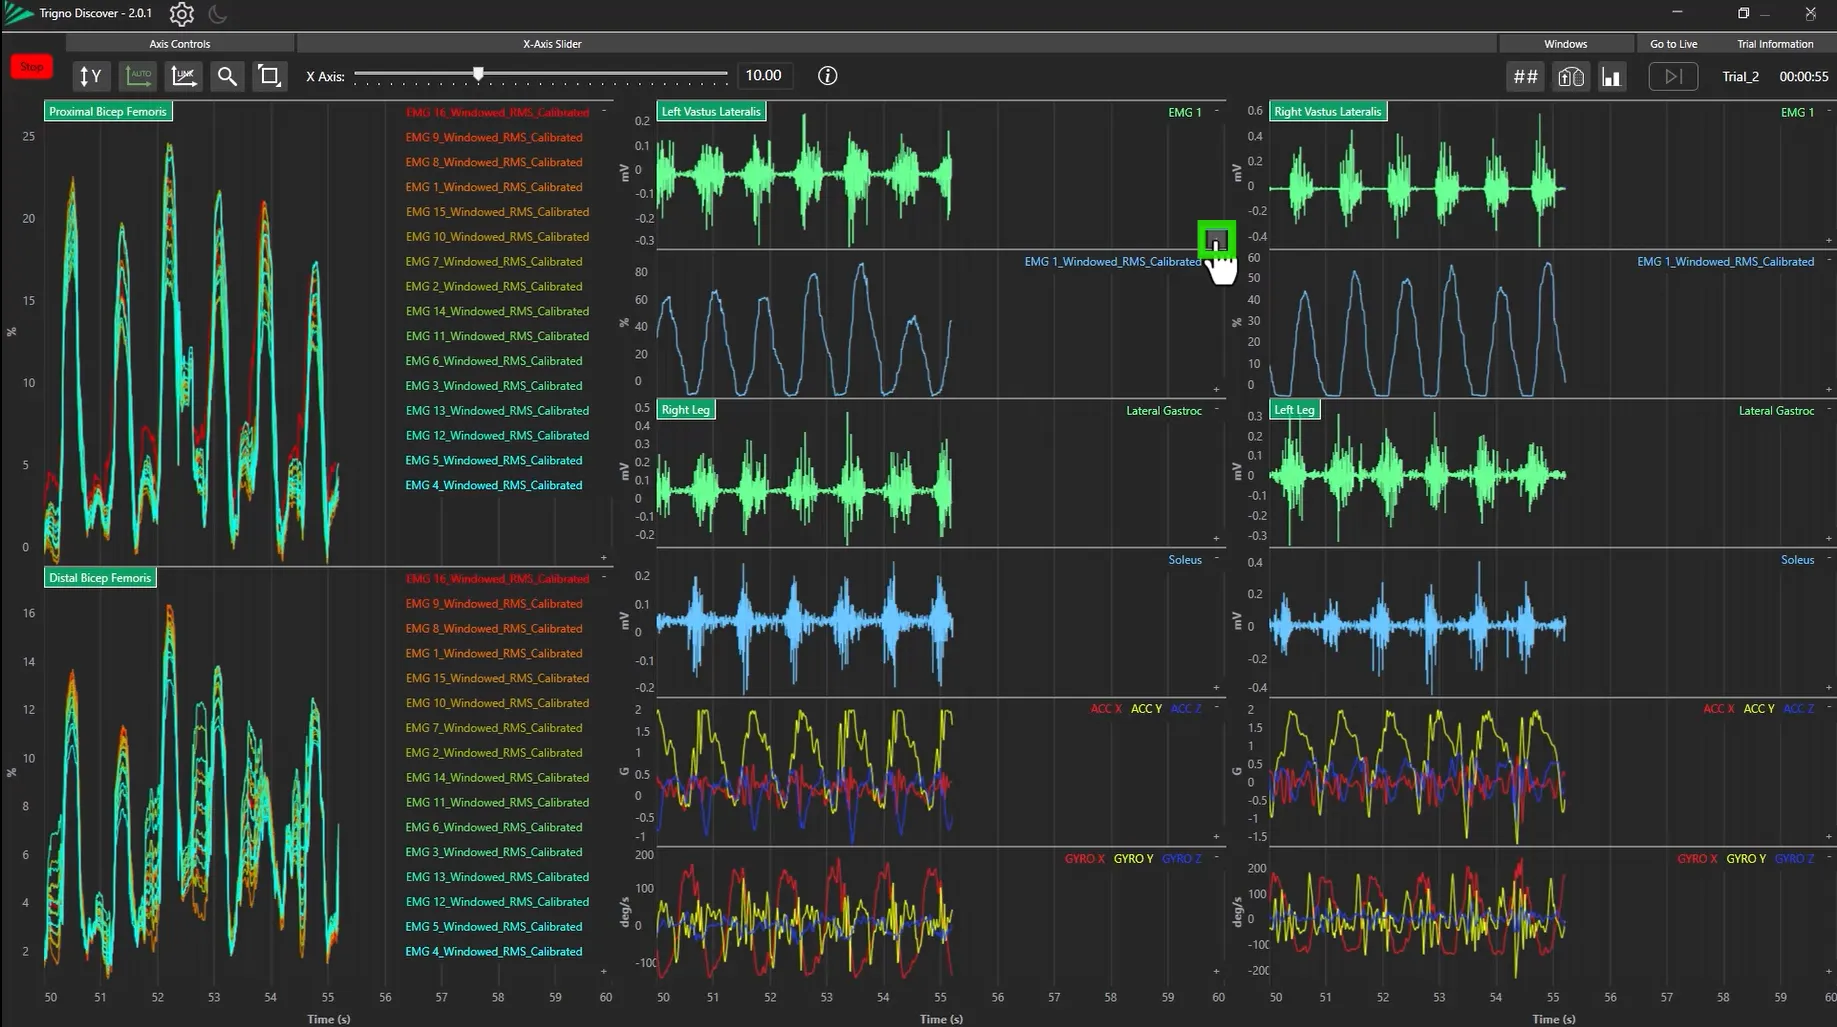
Expand and Collapse Plot Window
Click the “-” button on a channel to remove the Channel Name.
Click the “+” button on a channel.
Select the “Expand” icon to maximize the plotting window within the sensor row.
Select the “Full Screen” icon to assign the plotting window to the full display screen.
Click the “Expand” icon again to collapse the plotting window back.
Step 5: Marking Events
Add Single Event Marker
Press the F5 key, or right-click in the plot area, and select to add an event (See Trigno Discover: Event Marking).
Add Event Marker Pair
Press the F6 key, or right-click in the plot area, to add an event marker pair; both markers can be adjusted.
Adjust Event Marker
Click and drag the marker to reposition it along the X-axis.
Information
For more information on data plotting shortcuts, hover over the “i” icon.
Step 6: Ending the Trial and Reviewing Data
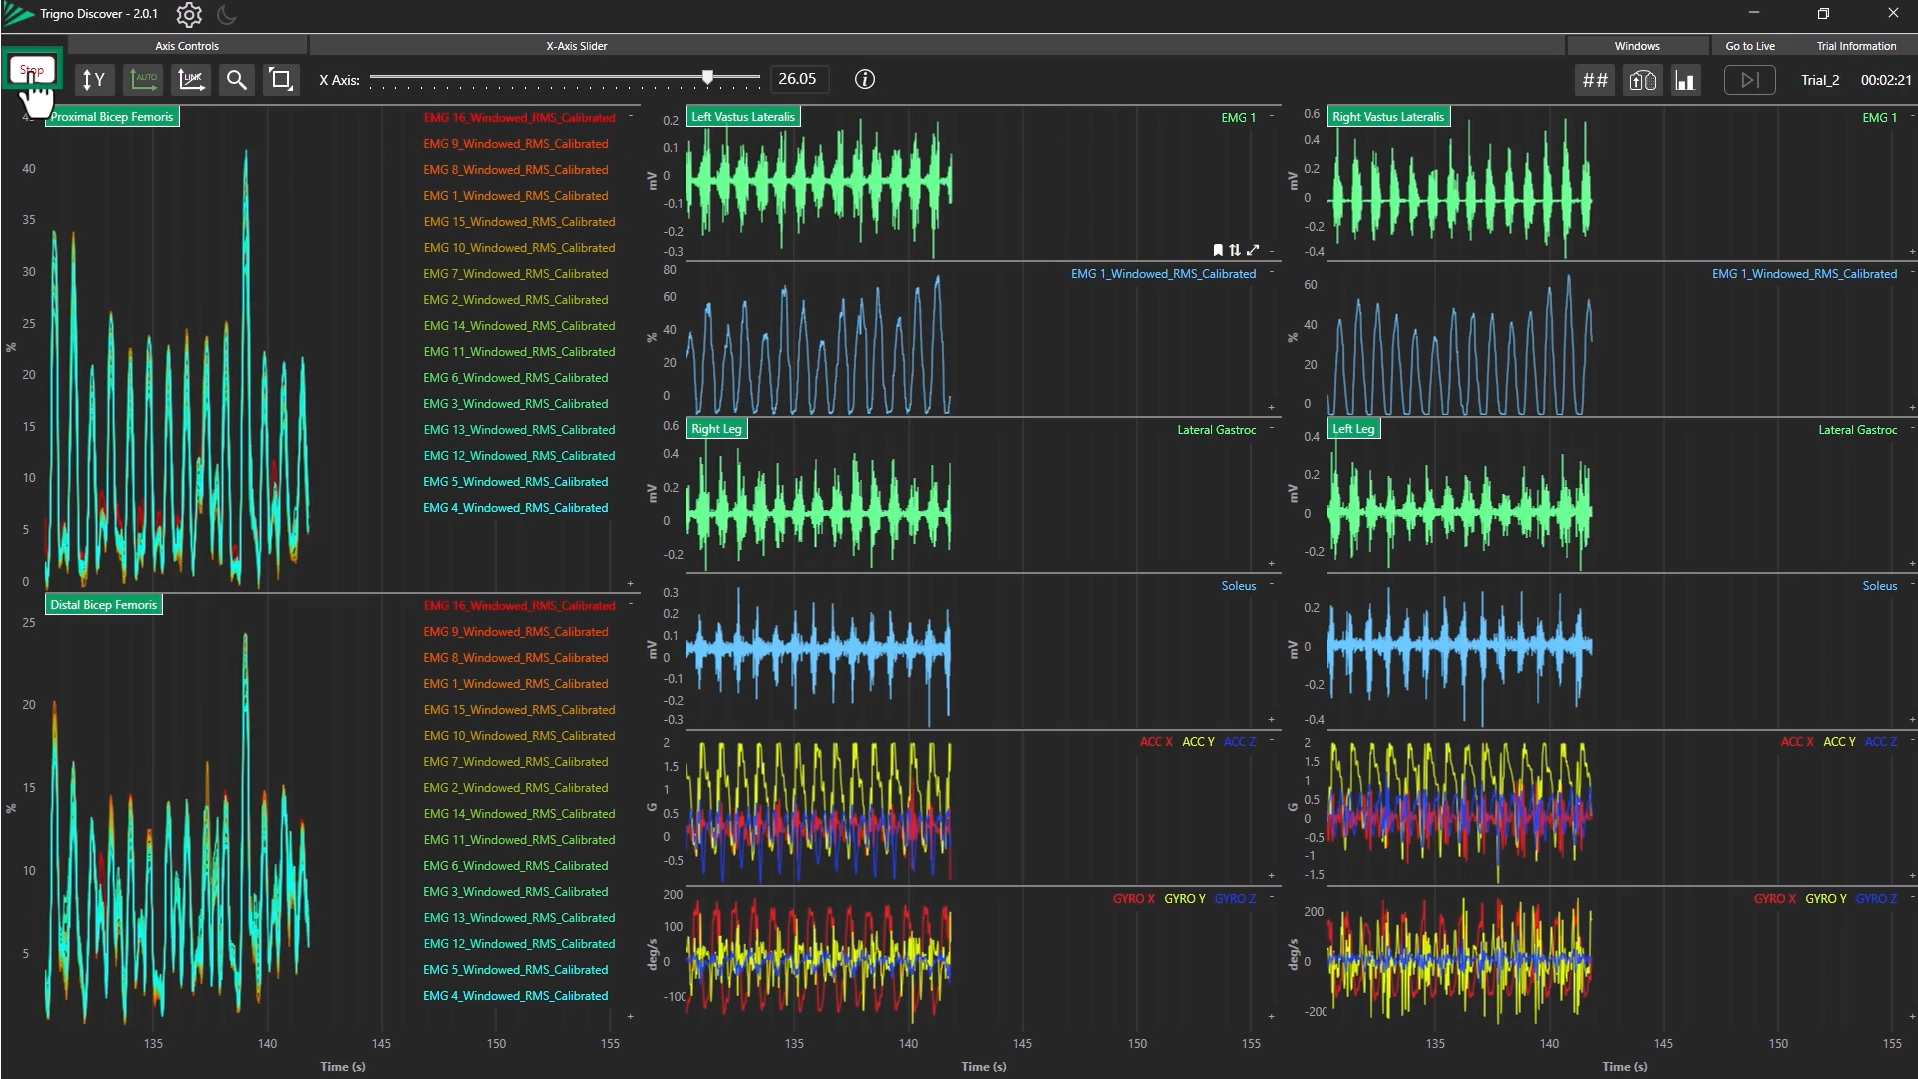
Stop Data Collection
Click the “Stop” button to end the trial.
Review Data
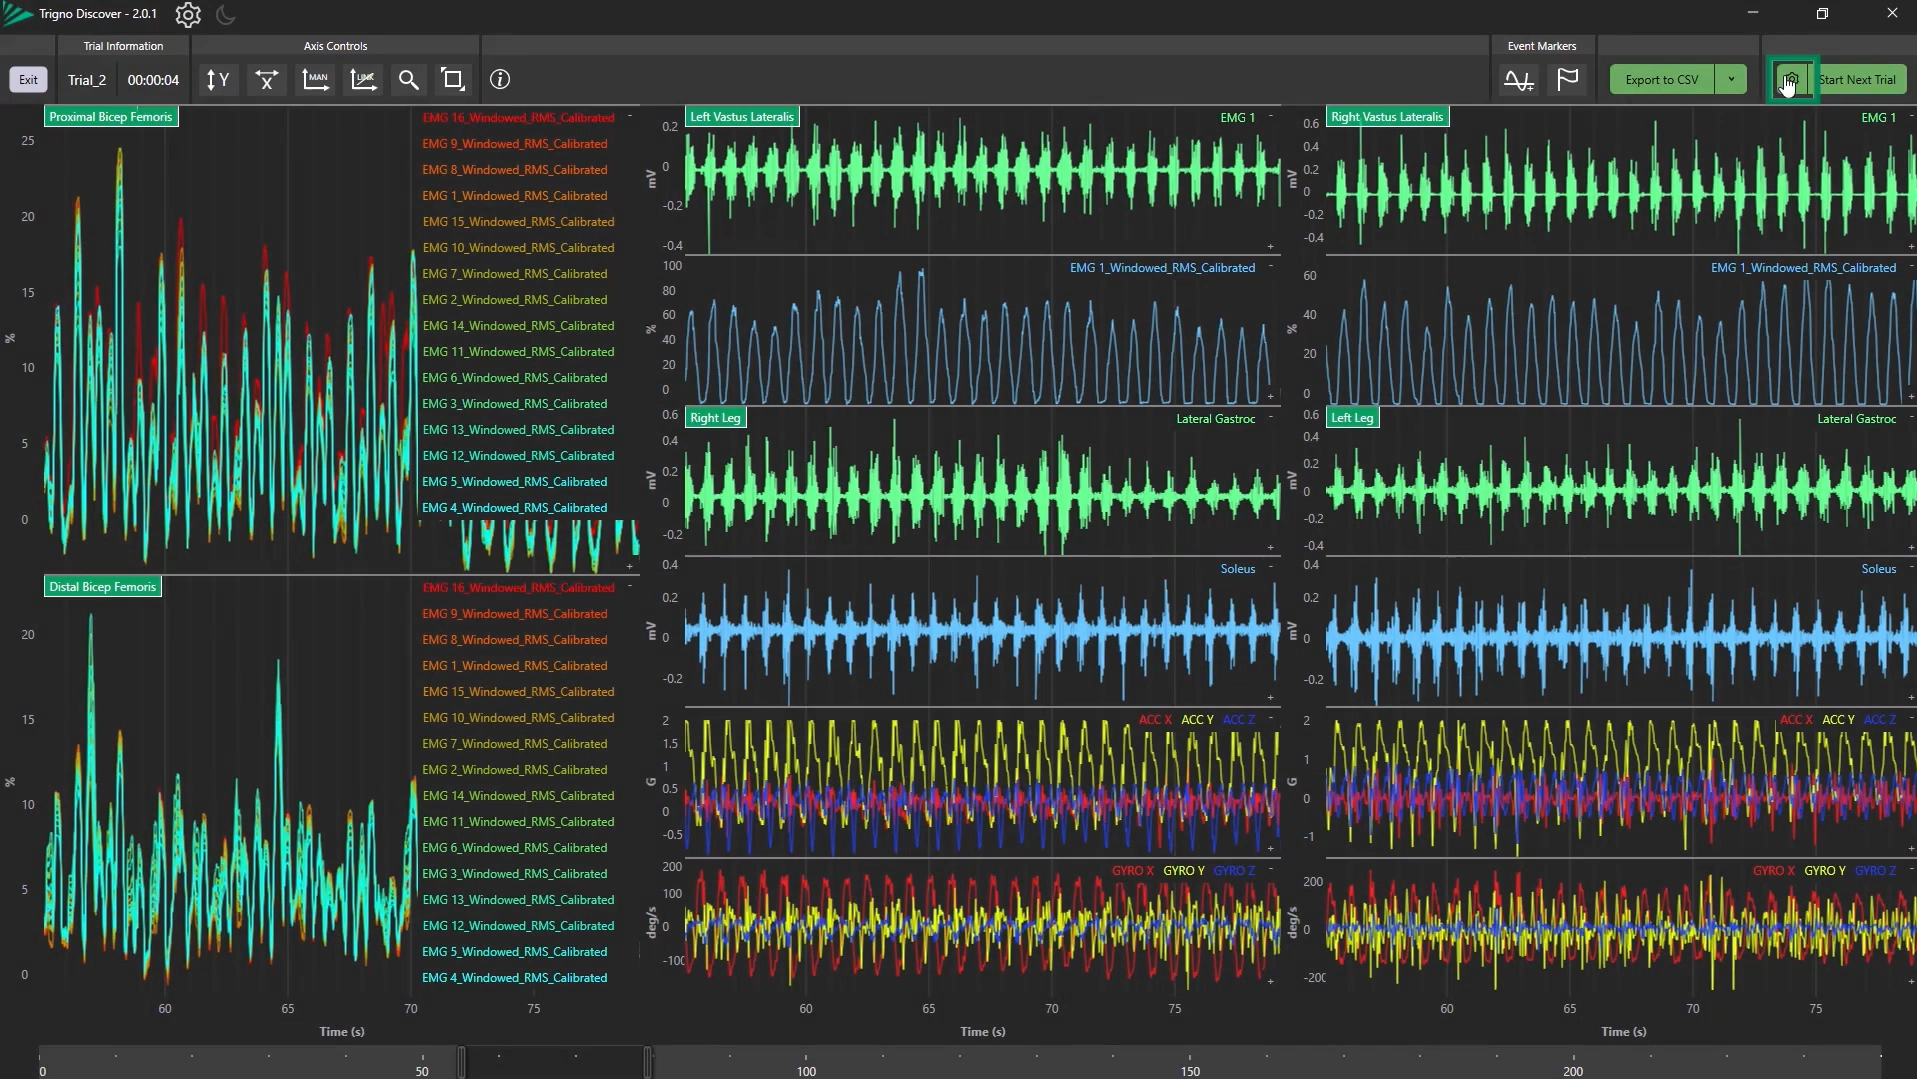
After stopping, the data from the whole trial will be displayed.
Right-click and drag around a region to zoom in on a specific section of the data.
Step 7: Exporting Data
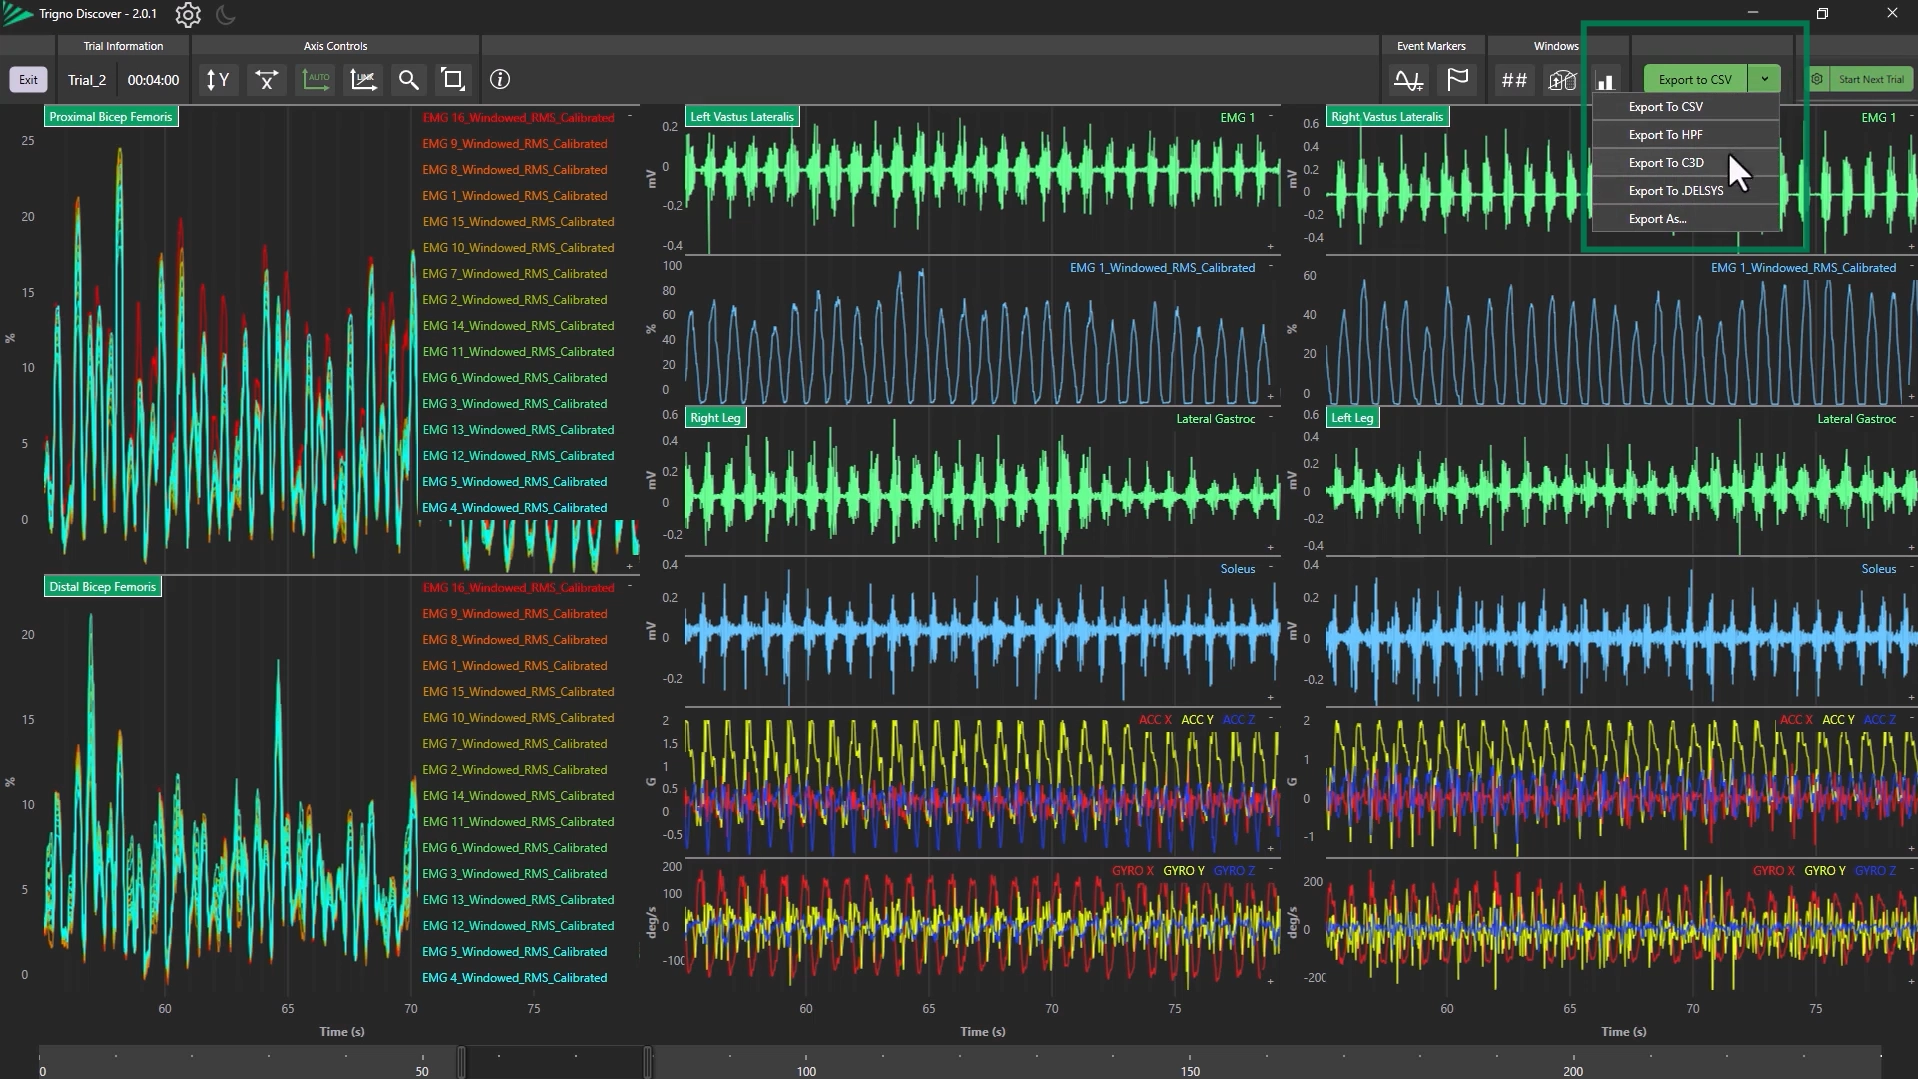
Open Export Menu
Click the “Export” dropdown in the top-right corner.
Select File Format and Export
Choose your desired format and export the data (For more advanced export options, see Trigno Discover: Advanced Export).
Step 8: Configuring the Next Trial
Open Trial Settings
Click the Settings Icon to access the trial configuration.
Apply Changes
Make changes and click “Apply” to save settings and prepare for the next trial.
Exit the review window by selecting “Exit”.
For more information on Trigno Discover, please refer to the next article in the Trigno Discover Getting Started Series: Trigno Discover: Biofeedback Displays.
DOC-668-1-0

.png)


