Overview
This guide covers setting up and using the biofeedback display features in the Trigno Discover software, enabling real-time visualization of data from Trigno sensors through the following:
Number Display: Shows the live RMS or normalized value at the top of the screen in a large number format.
Bar Chart: Shows the live RMS or normalized value as a dynamic bar chart for subject feedback.
Color Map: Shows the High-Density EMG activity distribution according to the Trigno Maize Sensor.
Designed for researchers, clinicians, and movement specialists, these tools allow for sensor-specific visual feedback, adjustable display settings, and enhanced interpretation of live EMG and IMU data during data collection sessions. You'll learn how to access each display mode, customize visual elements, and optimize feedback for applications such as motor training, performance monitoring, and neuromuscular assessments. For a visual walkthrough, please refer to the Trigno Discover Getting Started video tutorial on Biofeedback Displays.
Information
This article refers to Trigno Discover version 2.0.1. Please note that the user interface may vary depending on the version you have installed. You can find your current version of Trigno Discover in the top left corner of the application window.
Trigno Discover Getting Started Video Tutorial: Biofeedback Display
System Requirements
Material/Tool | Description |
|---|---|
Software | Trigno Discover 2.0 + |
Hardware: System | Trigno Centro; Trigno Lite; Trigno Research Base Station: |
Firmware: System | Trigno Centro: 06-05-00 | 04-01 + Trigno Lite: 02-02 + Trigno Research Base Station: Digital: 2919 | 1506 | 0806 | 2008 | 0000 Analog: 2919| 1506 | 0806 | 2008| 0901 |
Hardware: Sensors | Avanti-Style Sensors |
Firmware: Sensors | Avanti-Style Sensor: 40-49 Maize Sensor: 60-29 |
Operating System | Windows 11 |
PC Specifications |
|
Step-by-Step Instructions
Step 1: Biofeedback Display Configuration
Pair sensors (See Activating & Pairing Sensors).
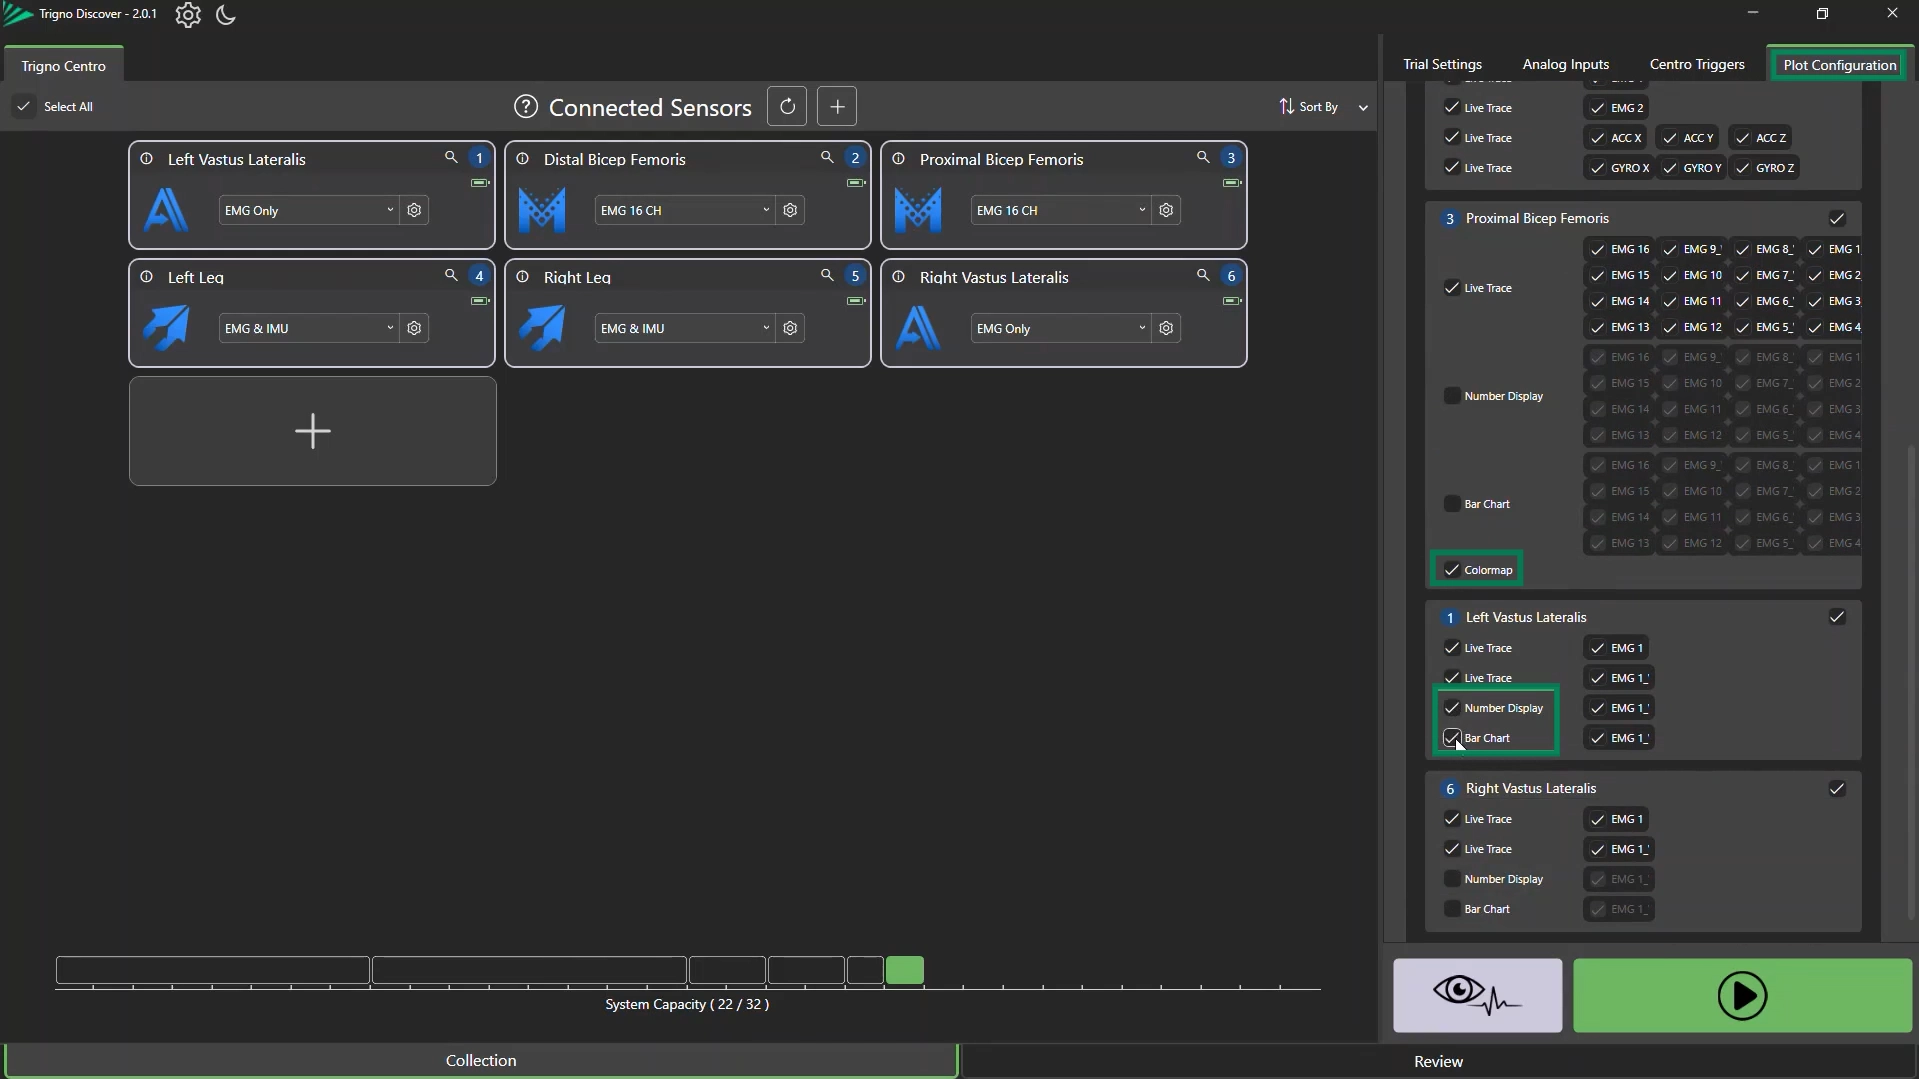
Navigate to the Plot Configuration tab in the right-hand menu.
For each connected sensor, select your preferred available display:
Color Map (Trigno Maize sensor only)
The Number Display, Bar Chart, and Color Map are available only when the sensor is configured in RMS and IMU mode or after calibration (See Trigno Discover: MVC Calibration).
Information
Color Map is only available for Trigno Maize sensors.
Biofeedback Displays will not be available unless sensors are in RMS and IMU mode or calibrated.
Step 2: Configuring the Number Display
Enable Number Display
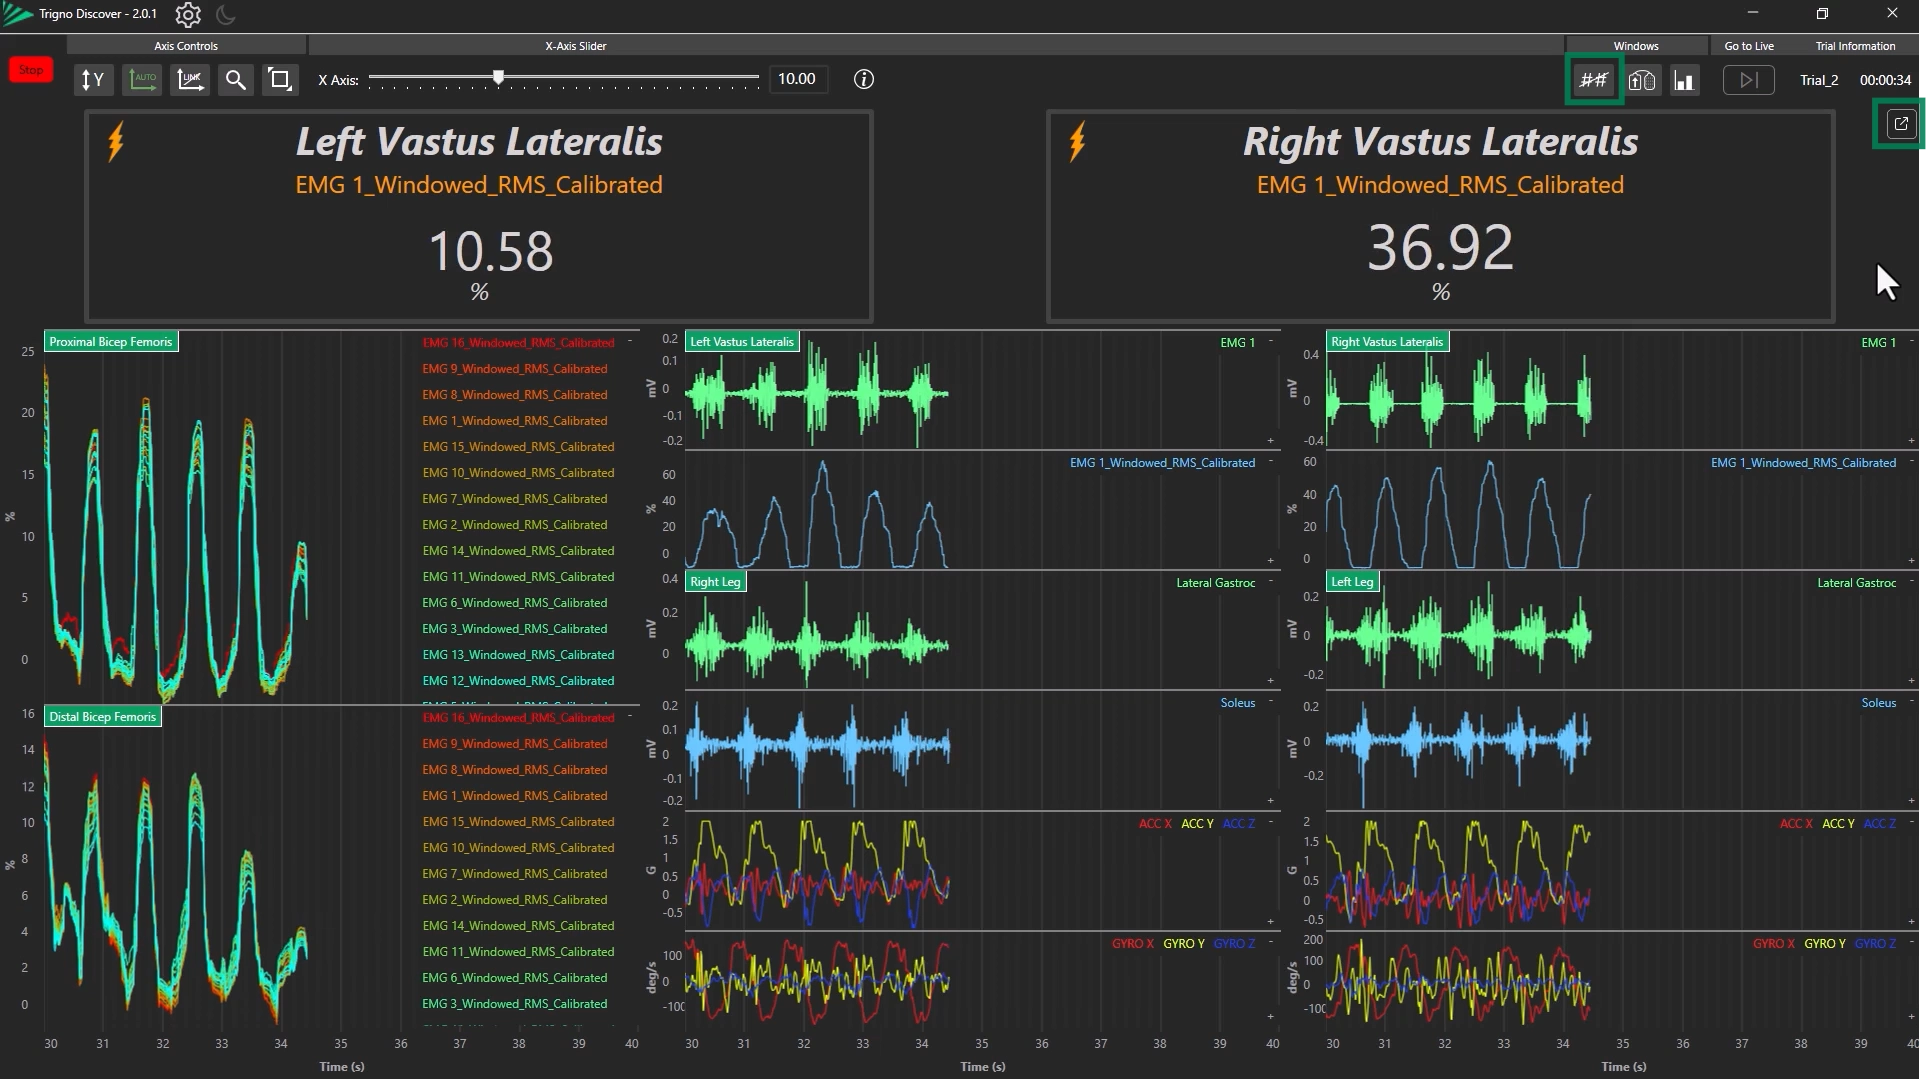
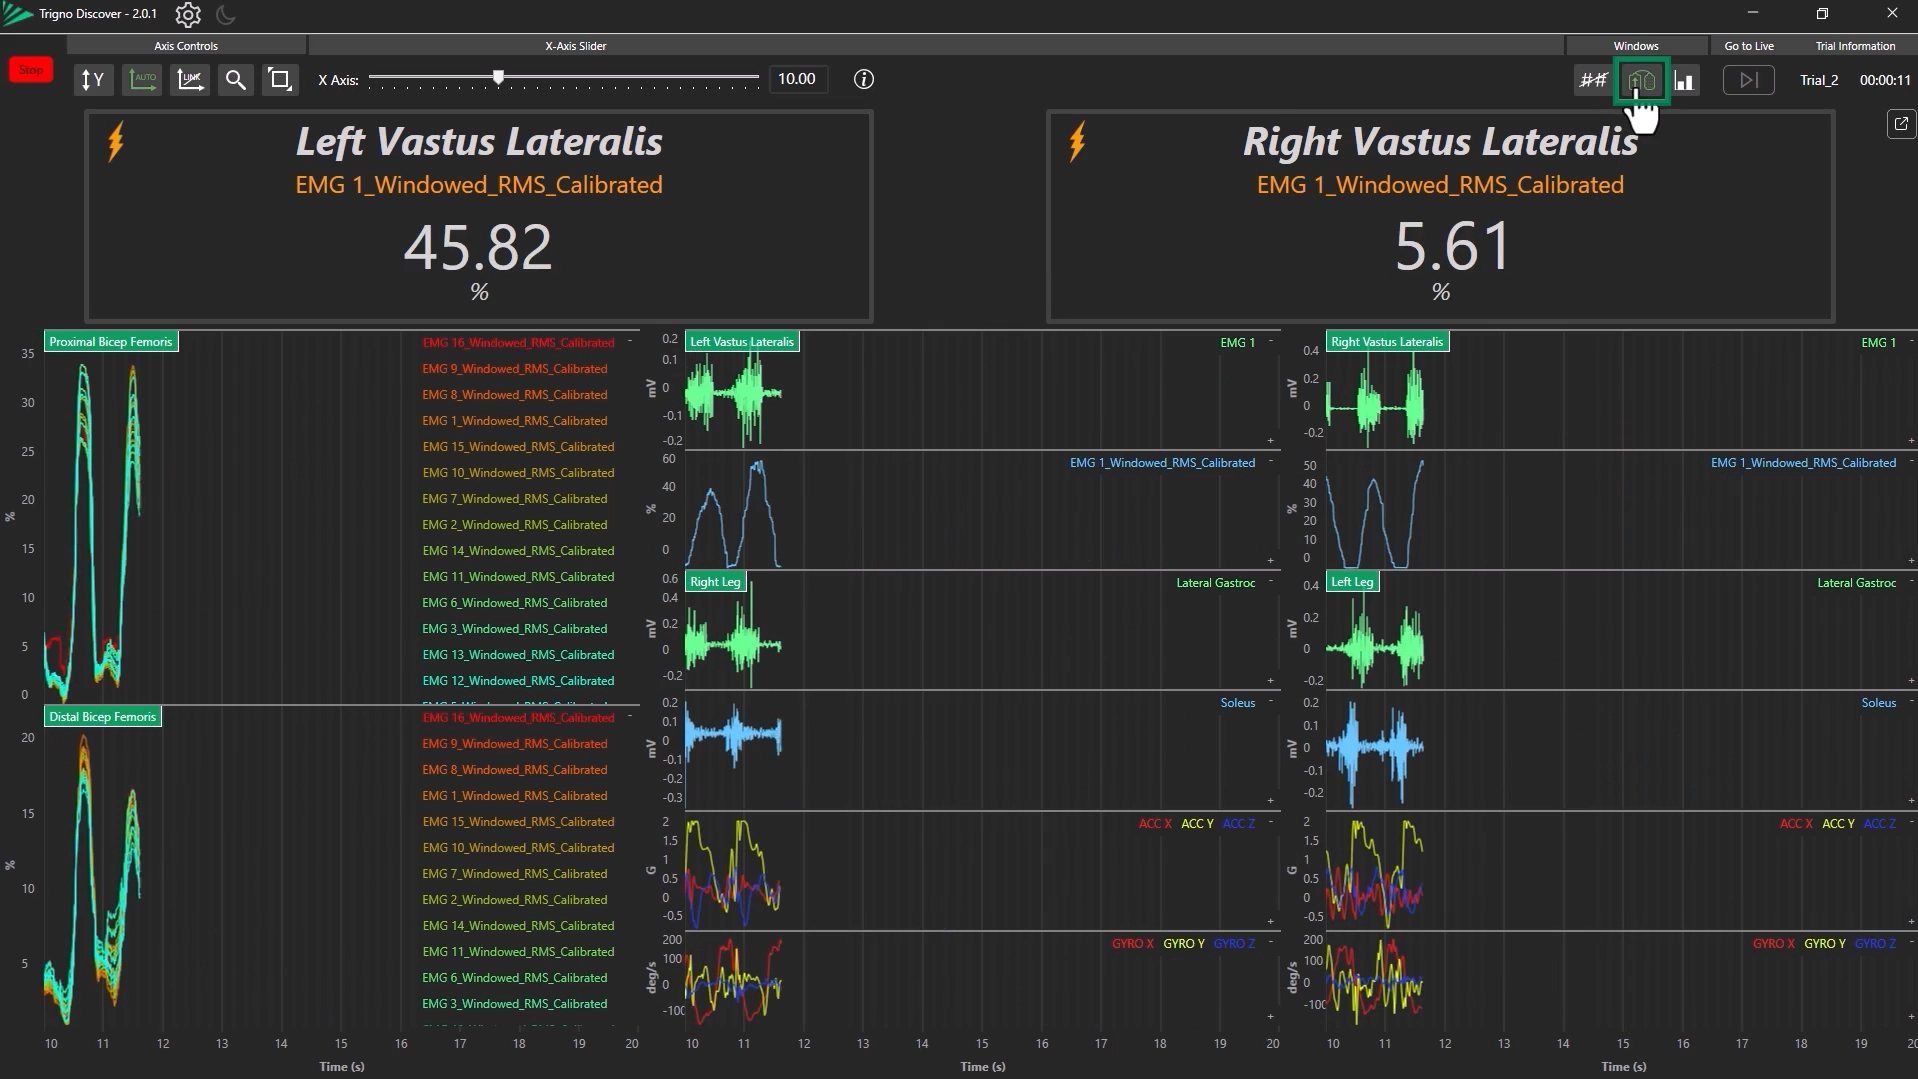
Selecting Number Display of a sensor in Plot Configuration will show the live RMS or normalized value at the top of the screen in a large number format.
Show/Hide Number Display
To hide it: Click the “Close Number View” icon under the “Windows” menu.
Click the same icon again to reopen.
Pop-out / Full Screen Mode
To open in a separate window, click the pop-out icon.
Double-click the header of the new window to enter full-screen.
Click the same icon again to dock the window back into the main interface.
Information
The Number Display is real-time only and reflects live values
Step 3: Configuring the Bar Chart
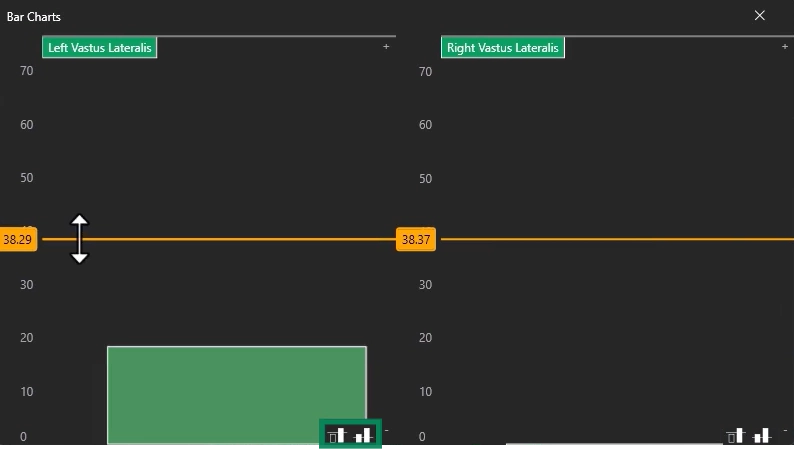
Open Bar Chart
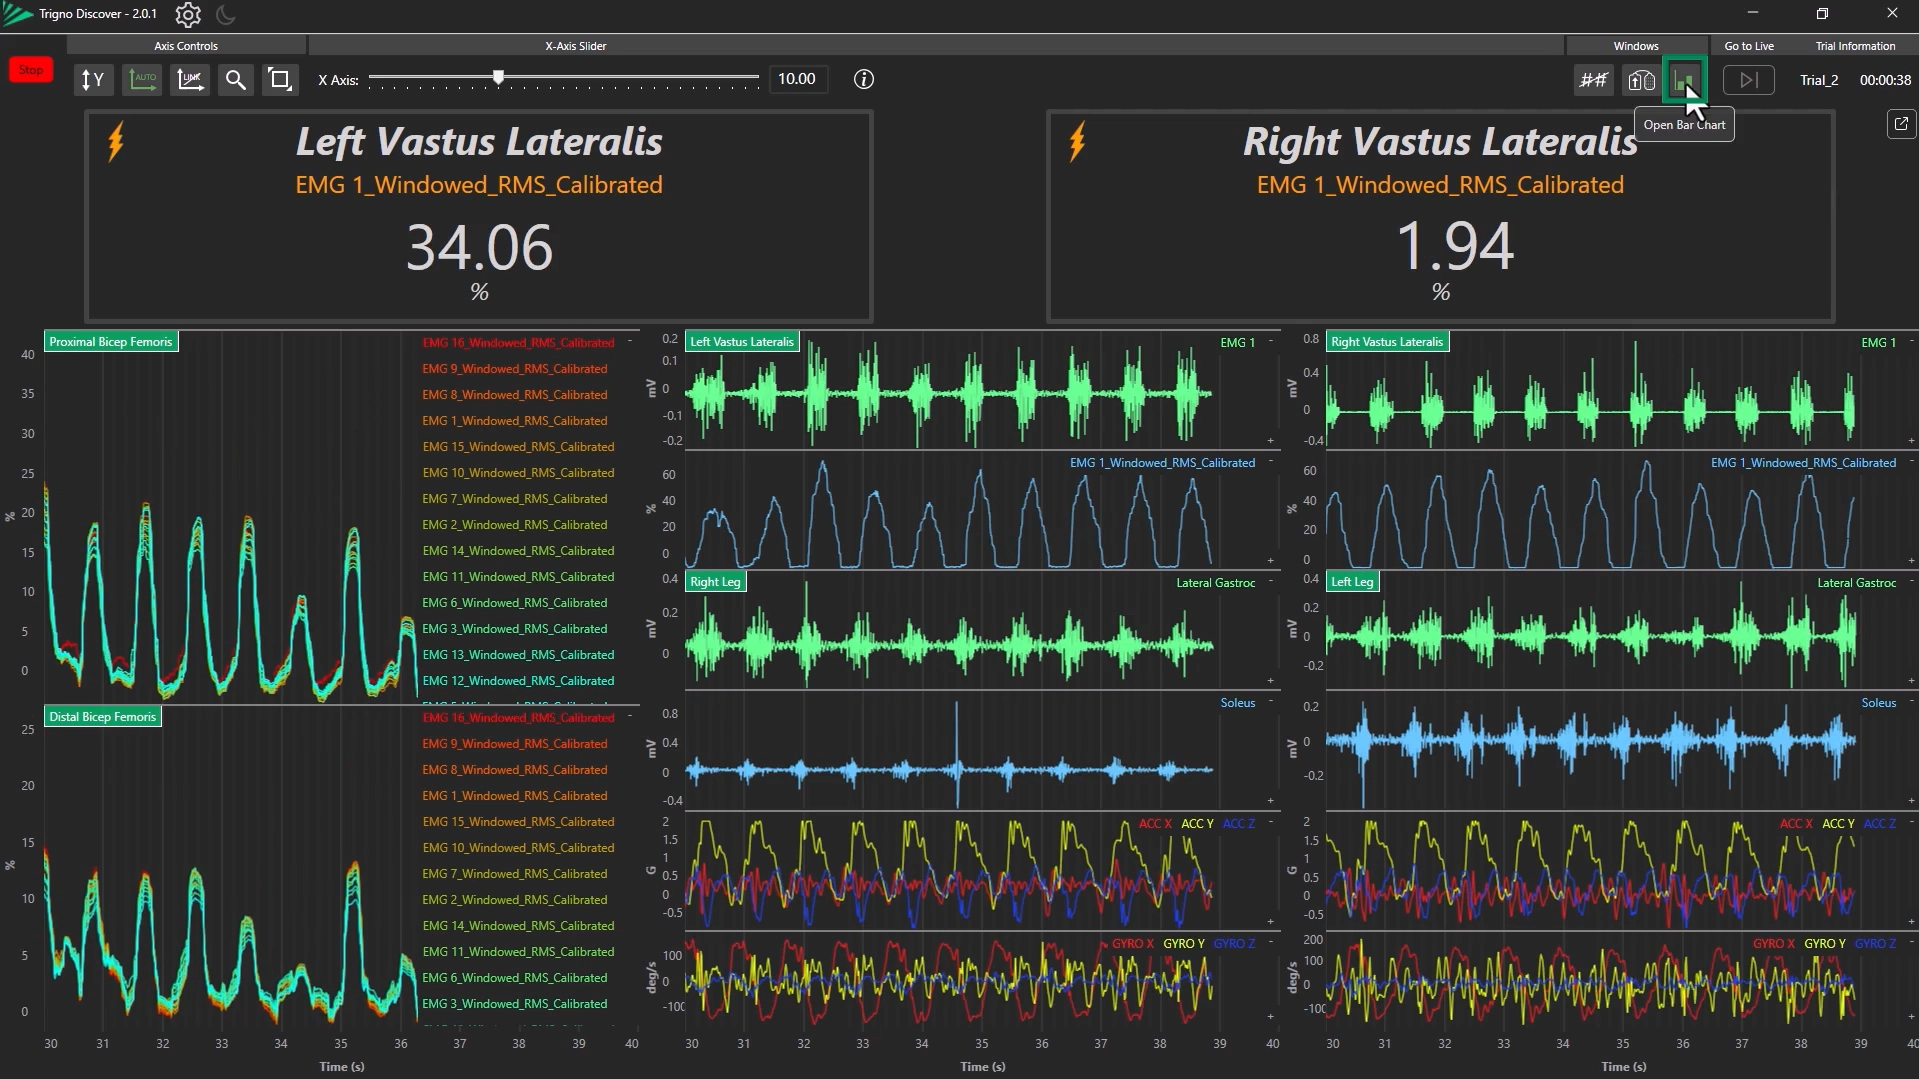
A pop-up will appear during live data collection.
To bring the window to the front, click the “Open Bar Chart” icon in the Windows menu.
Add & Adjust Thresholds
Click the “Add Threshold” icon (bottom right corner) to add up to two thresholds.
Move the Y-axis thresholds by dragging the yellow lines.
Click icons again to hide thresholds.
Scale the Y-Axis
Click and drag the Y-axis to adjust.
Double-click the Sensor Name in the top-left of the chart to reset the scale.
Close Bar Chart
Select the “Close Bar Chart” icon to remove the window.
Step 4: Configuring the Color Map
Open Color Map
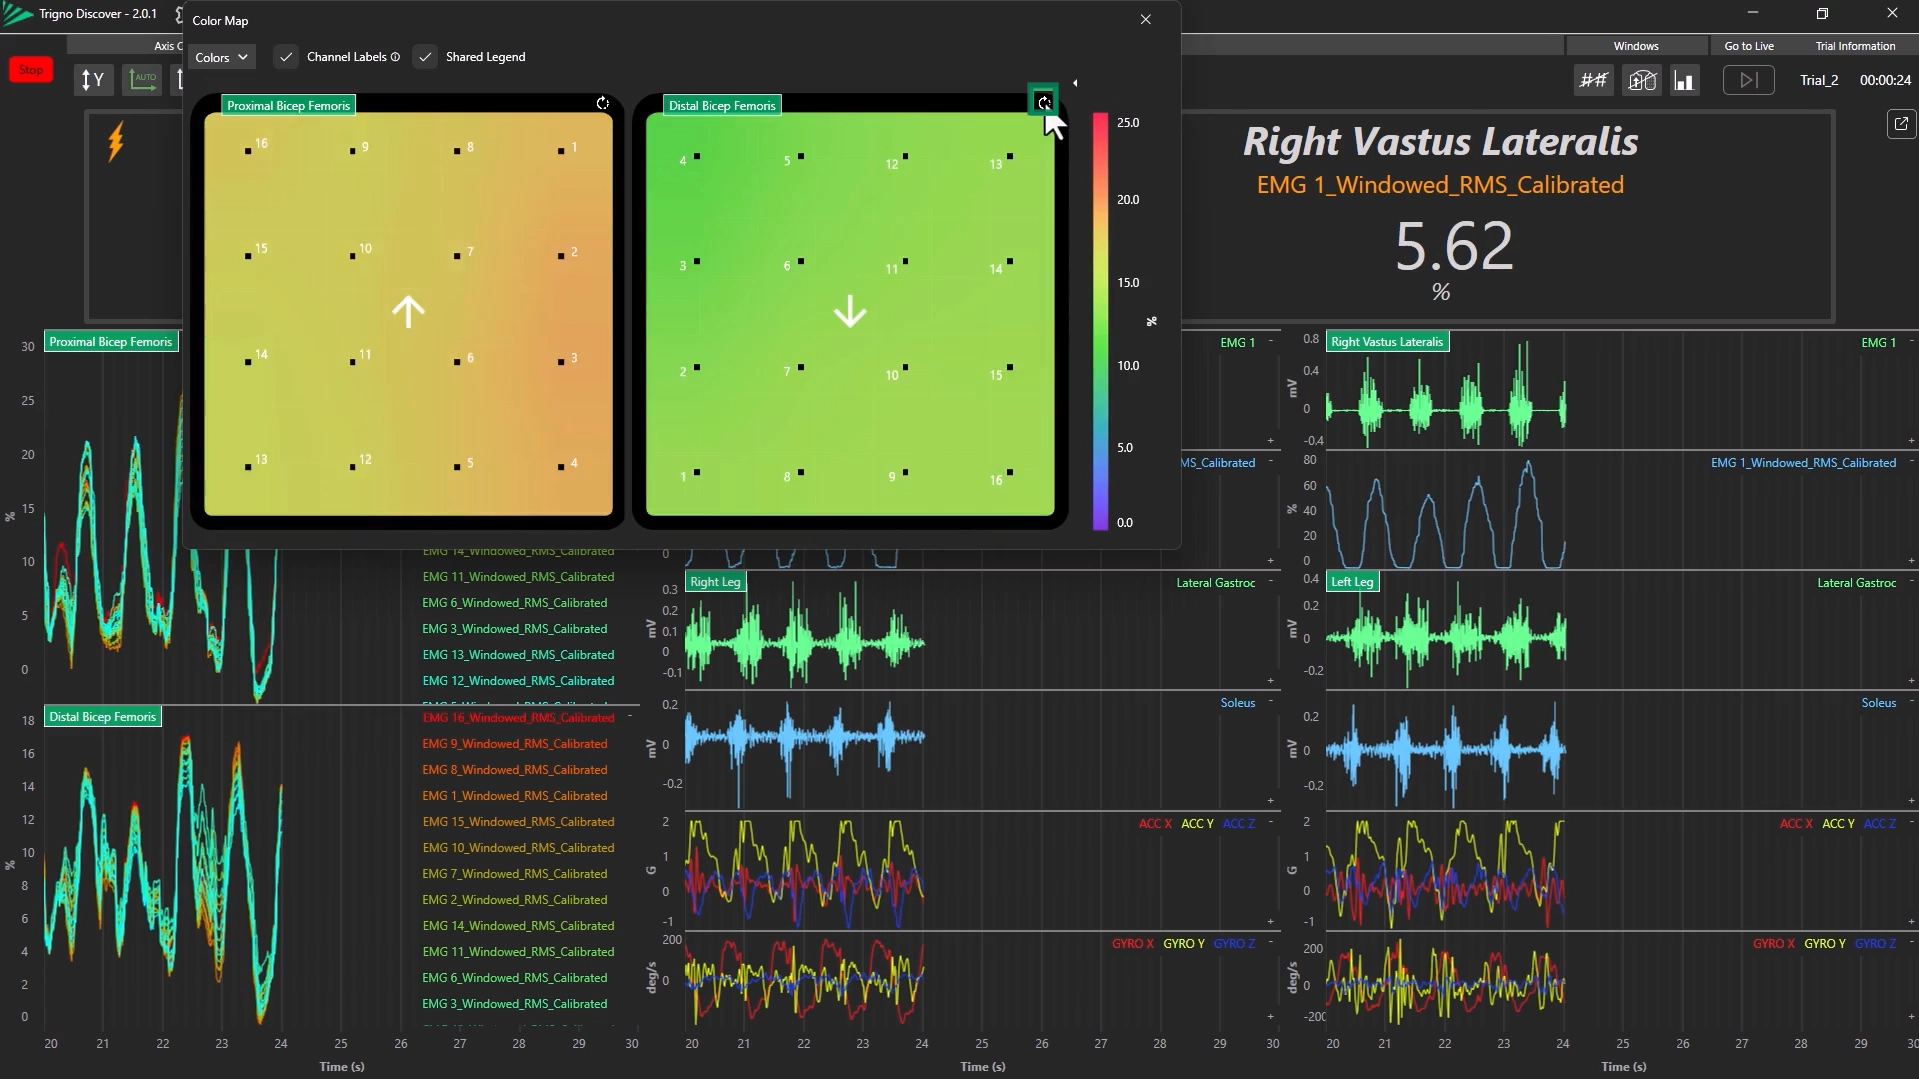
During live collection, click “Open Color Map” under the Windows section.
Adjust the Y-Axis
Click and drag the Y-axis to scale.
Use the small arrow icon in the top-right to expand/collapse the Y-axis view.
Select the “Shared Legend” box to create a common Y-axis scale for multiple Trigno Maize sensors.
Rotate Display
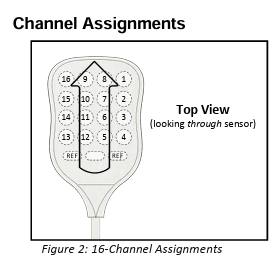
The default Color Map will correspond to the Default Maize Channel Assignment according to the Maize user guide.
Click the rotate icon to shift channel orientation by 90°.
This aligns the display with the actual sensor placement on the muscle.
Show/Hide Channel Labels
Uncheck “Channel Labels” to hide channel numbers.
Change Color Scheme
Use the “Colors” dropdown menu to select different color palettes.
Close Color Map
Use the “Close Color Map” icon to close the window.
Information
Ensure visual orientation matches physical sensor placement (as best as possible).
Color Maps only work with Trigno Maize sensors in RMS + IMU or calibrated mode.
For more information on Trigno Discover, please refer to the next article in the Trigno Discover Getting Started Series: Trigno Discover: Event Marking.
DOC-671-1-0