
Overview
This guide walks you through using event marking tools in Trigno Discover to identify, manage, analyze key moments in your data collections, and to prepare your data for Trigno Analytics. You’ll learn how to automatically generate event markers based on signal thresholds, manually place and adjust markers, and configure advanced settings such as Hold-Off Time, Slope Direction, and Time Offset. The guide also covers creating event marker pairs, tagging events for easy retrieval, and exporting data for further analysis. For a visual walkthrough, refer to the Trigno Discover video tutorials on Event Marking.
Information
This article refers to Trigno Discover version 2.0.1. Please note that the user interface may vary depending on the version you have installed. You can find your current version of Trigno Discover in the top left corner of the application window.
Trigno Discover Getting Started Video Tutorial: Event Marking
System Requirements
Material/Tool | Description |
|---|---|
Software | Trigno Discover 2.0 + |
Hardware: System | Trigno Centro; Trigno Lite; Trigno Research Base Station |
Firmware: System | Trigno Centro: 06-05-00 | 04-01 + Trigno Lite: 02-02 + Trigno Research Base Station: Digital: 2919 | 1506 | 0806 | 2008 | 0000 Analog: 2919| 1506 | 0806 | 2008| 0901 |
Hardware: Sensors | Avanti-Style Sensors |
Firmware: Sensors | Avanti-Style Sensor: 40-49 Maize Sensor: 60-29 |
Operating System | Windows 11 |
PC Specifications |
|
Step-by-Step Instructions
Step 1: Opening Trigno Discover and Selecting a File
Navigate to the Review tab in the lower right corner of the Trigno Discover window.
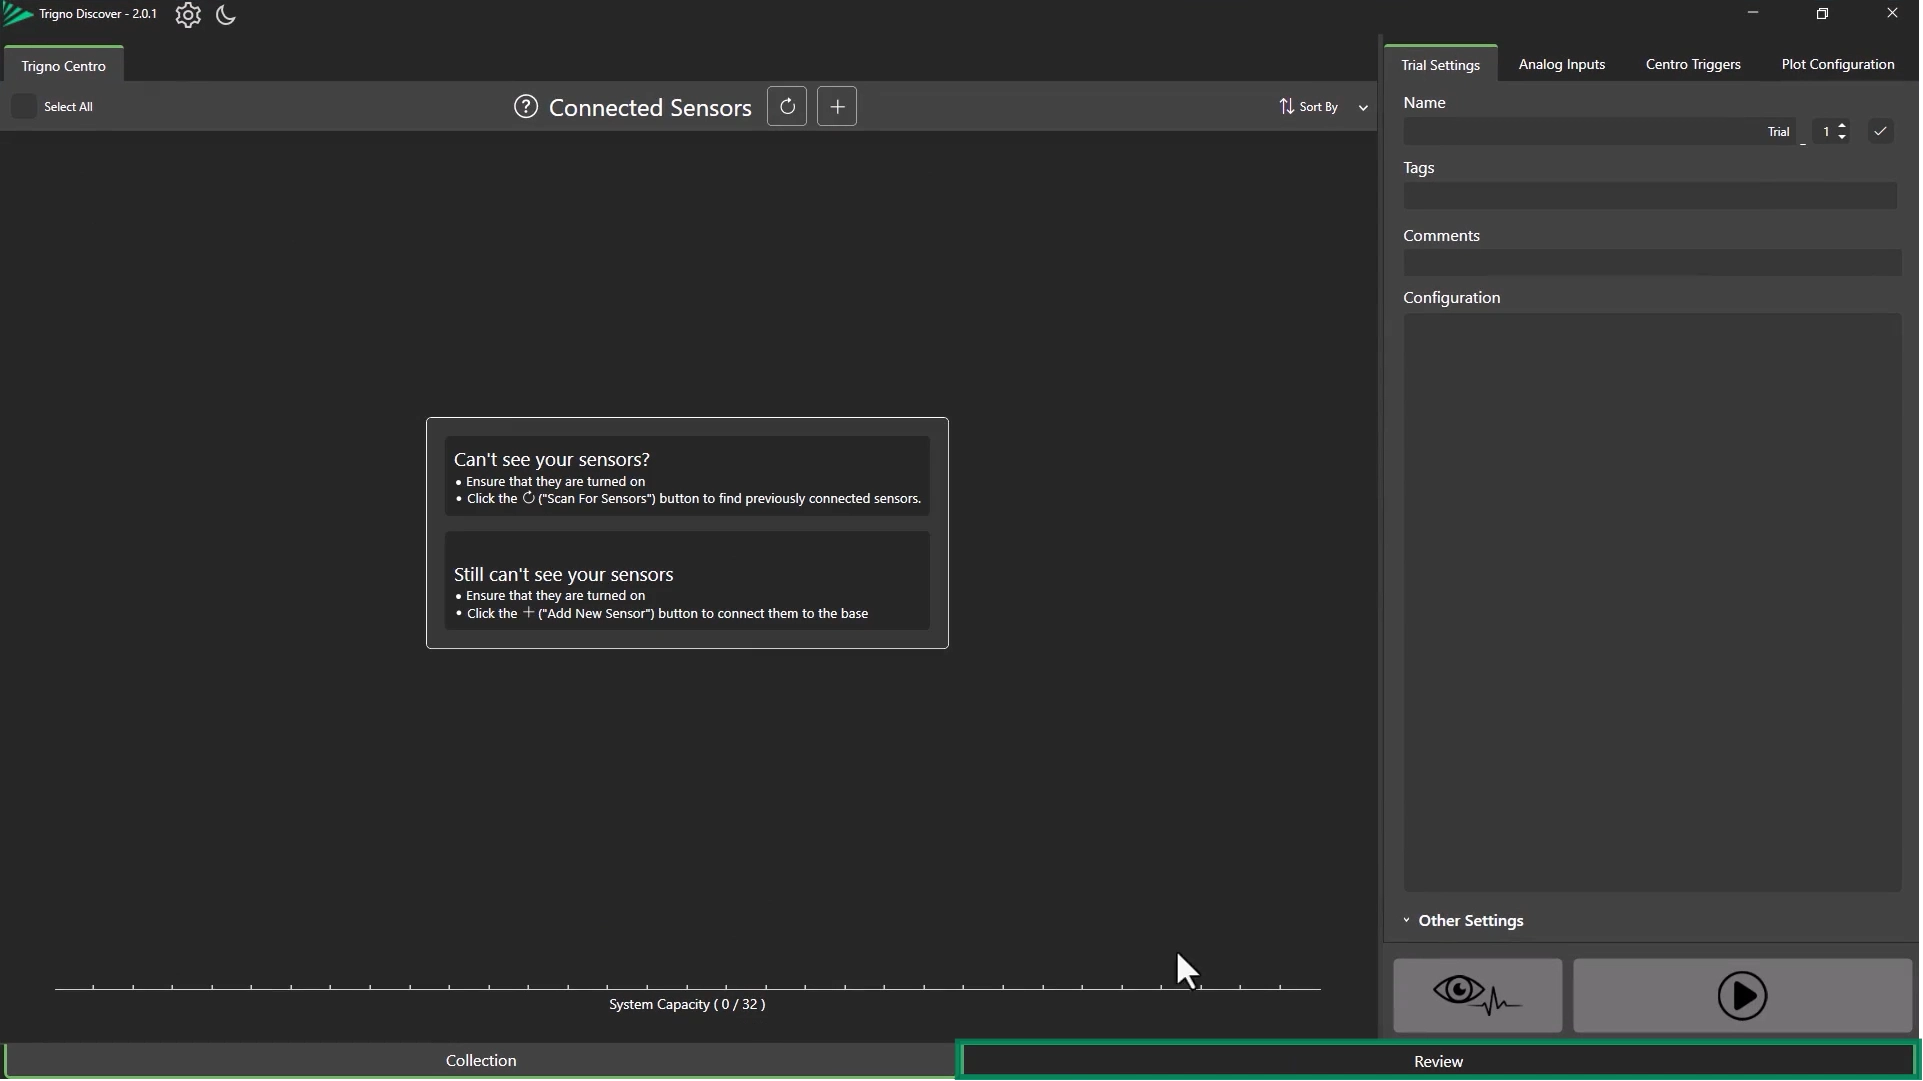
Selecting a Data File
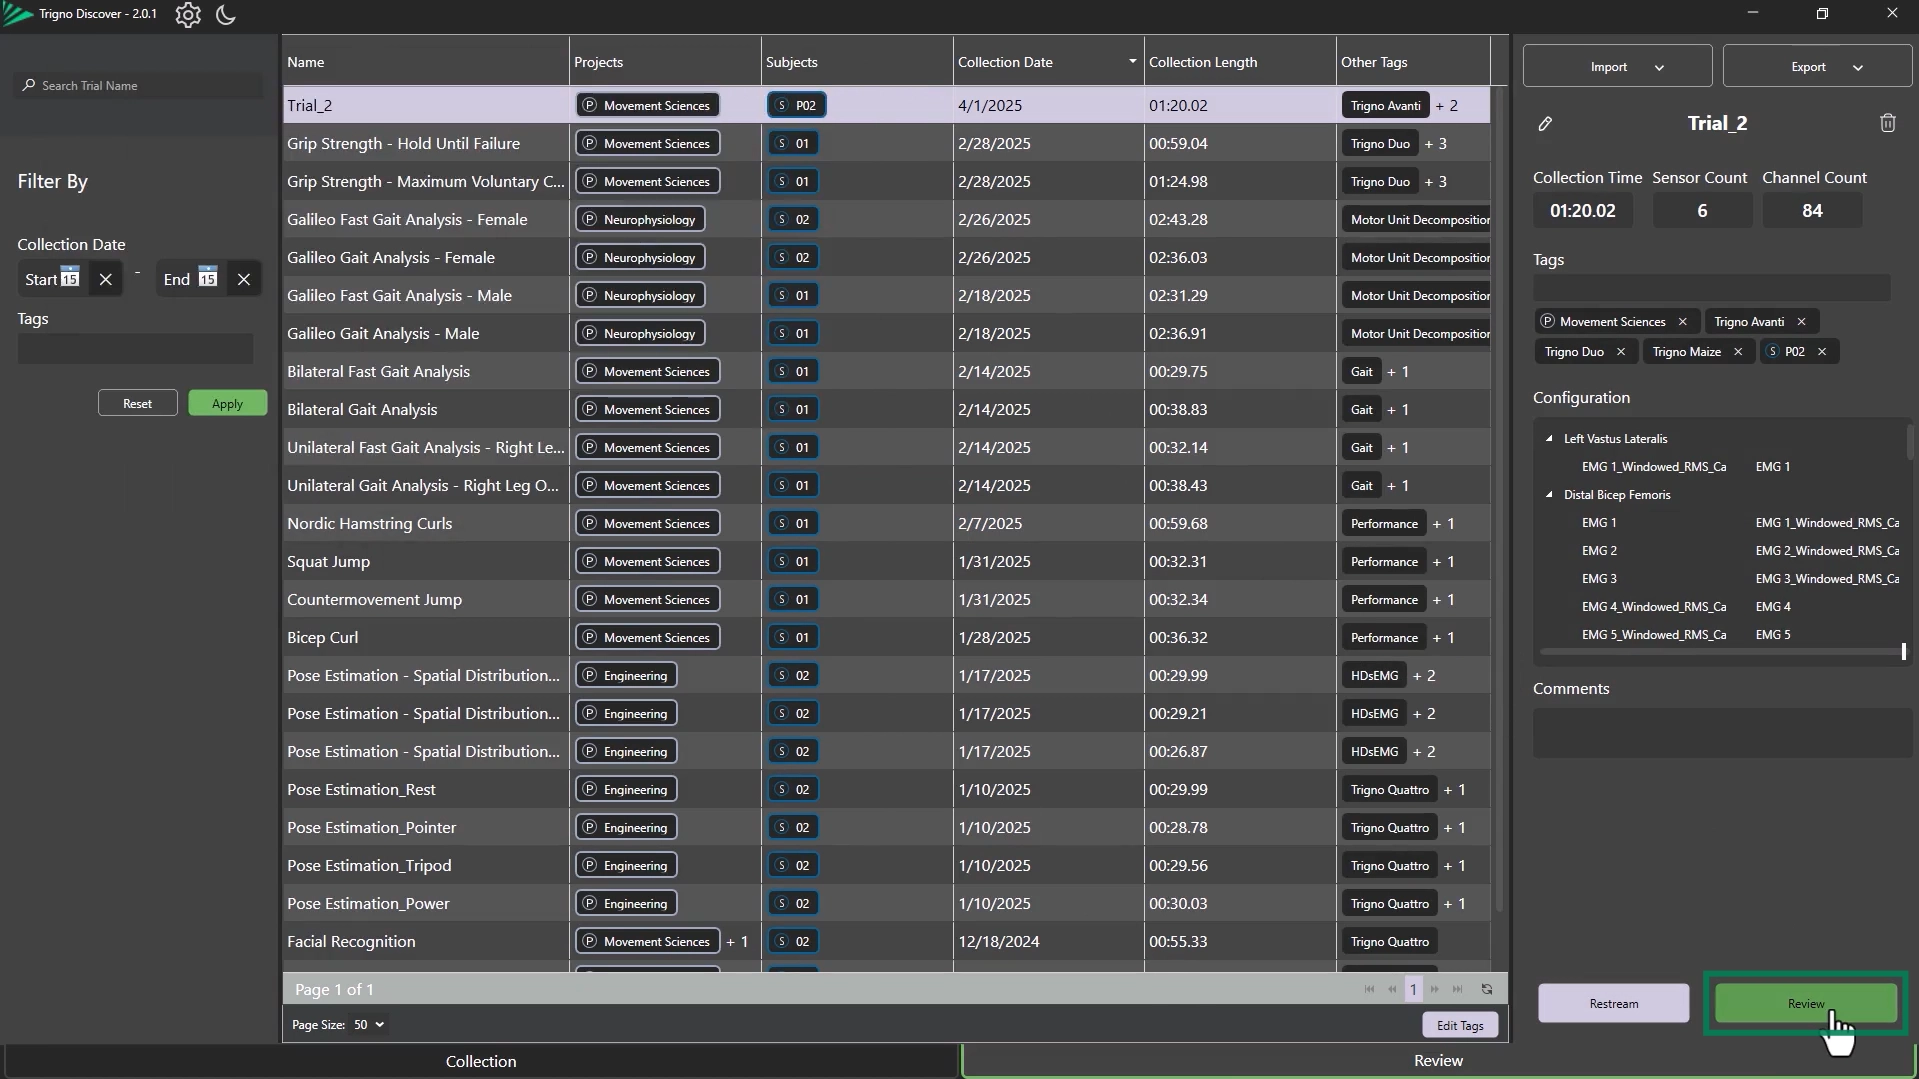
Select a file for review from your list.
Click “Review” to open the file.
Step 2: Accessing Event Marker Tools
Opening Marker Controls
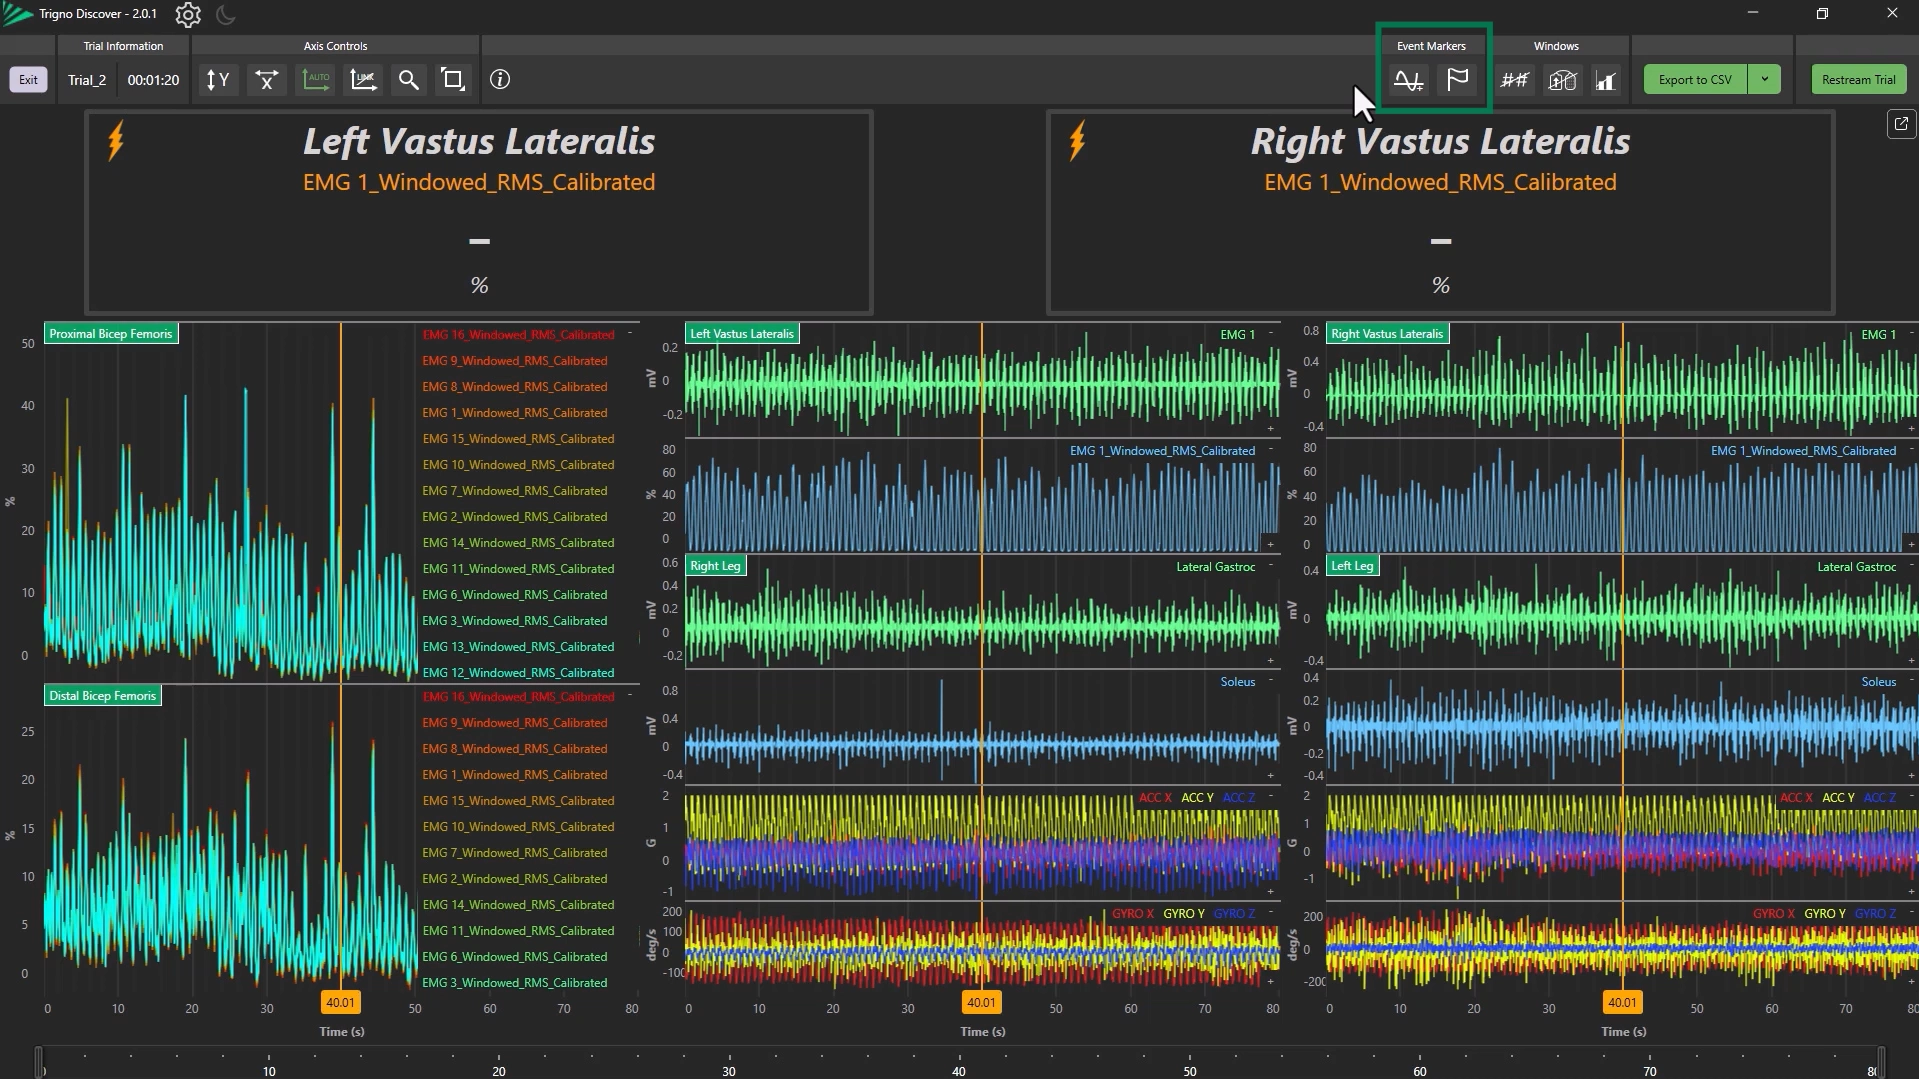
In the opened file, find the Event Marking options.
Click either:
Make Event Markers Based on Threshold - Used to auto-generate markers when a signal crosses a defined threshold with customizable settings.
Open Event Markers Pane - Used to manually place and manage markers for specific time points during data review.
Placing Event Markers During Live Collection
Event Markers can also be placed during a live data collection (See Trigno Discover Getting Started Series: Data Collection).
Press F5 to drop a single marker.
Press F6 to drop a marker pair.
Or right-click on the data and select the event marker or event marker pair options.
Step 3: Make Event Markers Based on Threshold
Choosing a Channel and Sensor
Open the Make Event Markers Based on Threshold tool
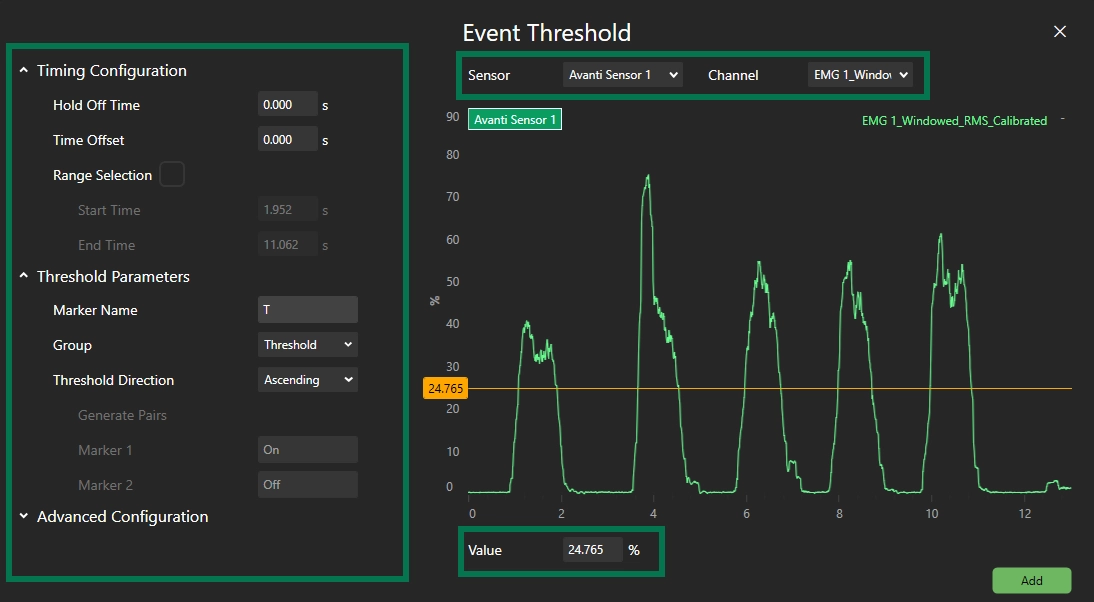
In the Event Markers Based on Threshold window:
Select a sensor and channel from the dropdowns.
Set a threshold by:
Dragging the Threshold Value Indicator, or
Typing the value manually.
Setting Hold-Off Time
Add a Hold-off time (in seconds) to prevent multiple detections in quick succession.
Recommendation
The Make Event Markers Based on Threshold option allows for markers to be placed automatically after the signal crosses a defined threshold on a selected channel of collected data. Avoid using raw EMG data for threshold marking due to its stochastic nature.
Using Time Offset
Define a Time Offset to position event marker placements before/after a threshold-crossing.
Information
Choosing a negative time offset will shift all event markers to the left of the threshold crossings, while a positive time offset will shift them to the right.
Threshold Range Options
Enable “Range Selection” to limit event marking to specific times:
Drag start/end points on the X-axis, or
Enter values in Start Time and End Time fields.
Threshold Parameters
Markers can be named under “Marker Name”. Markers will be numbered based on the order of creation.
Markers can be grouped by creating group names. To create a group, type the desired name into the Search bar.
Event markers can be generated based on the Slope Direction of the signal at the threshold-crossing point.
Ascending: Marks only positive (upward) slopes.
Descending: Marks only negative (downward) slopes.
Both: Marks threshold crossings in both upward and downward directions.
Generating Marker Pairs
Click “Generate Pairs” to create paired markers between threshold crossings.
Pairs can only be generated when the Threshold Direction is set to “both”.
“Generate Pairs” needs to be selected in order to create paired event markers
Marker 1 and Marker 2 can be renamed in the corresponding boxes
Information
In order to generate marker pairs, threshold direction must be set to “both”.
Step 4: Advanced Configurations in the Event Threshold
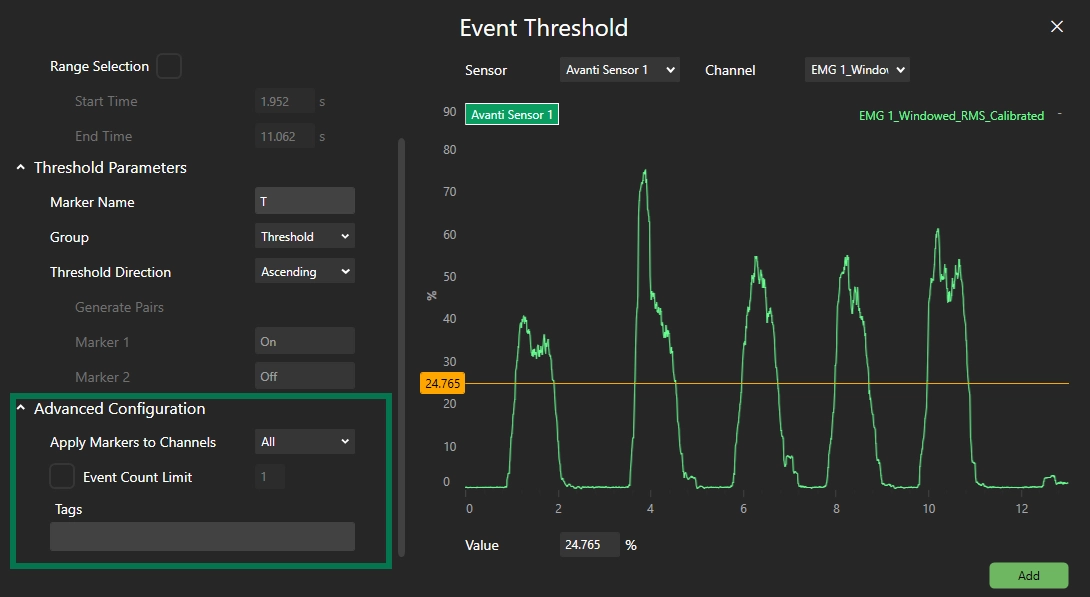
Setting Event Count Limits
Use Advanced Configurations to:
Limit the total number of detected events via Event Count Limit.
Use Apply Markers to Channels to assign specific channels.
Step 5: Creating and Adjusting Event Markers
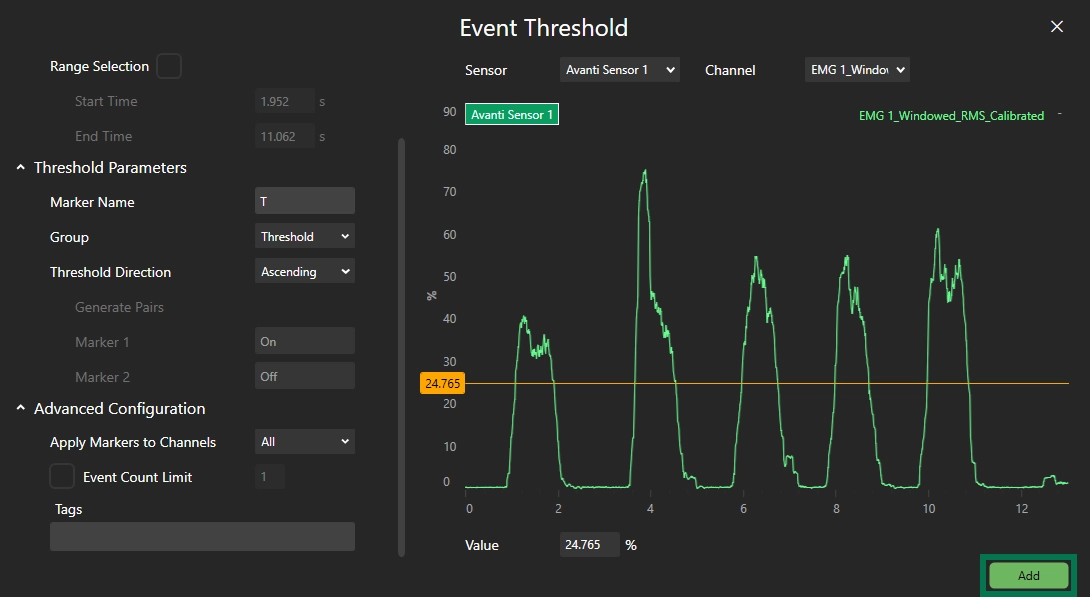
Adding Markers
After setting parameters in the Event Threshold, click “Add” to place markers.
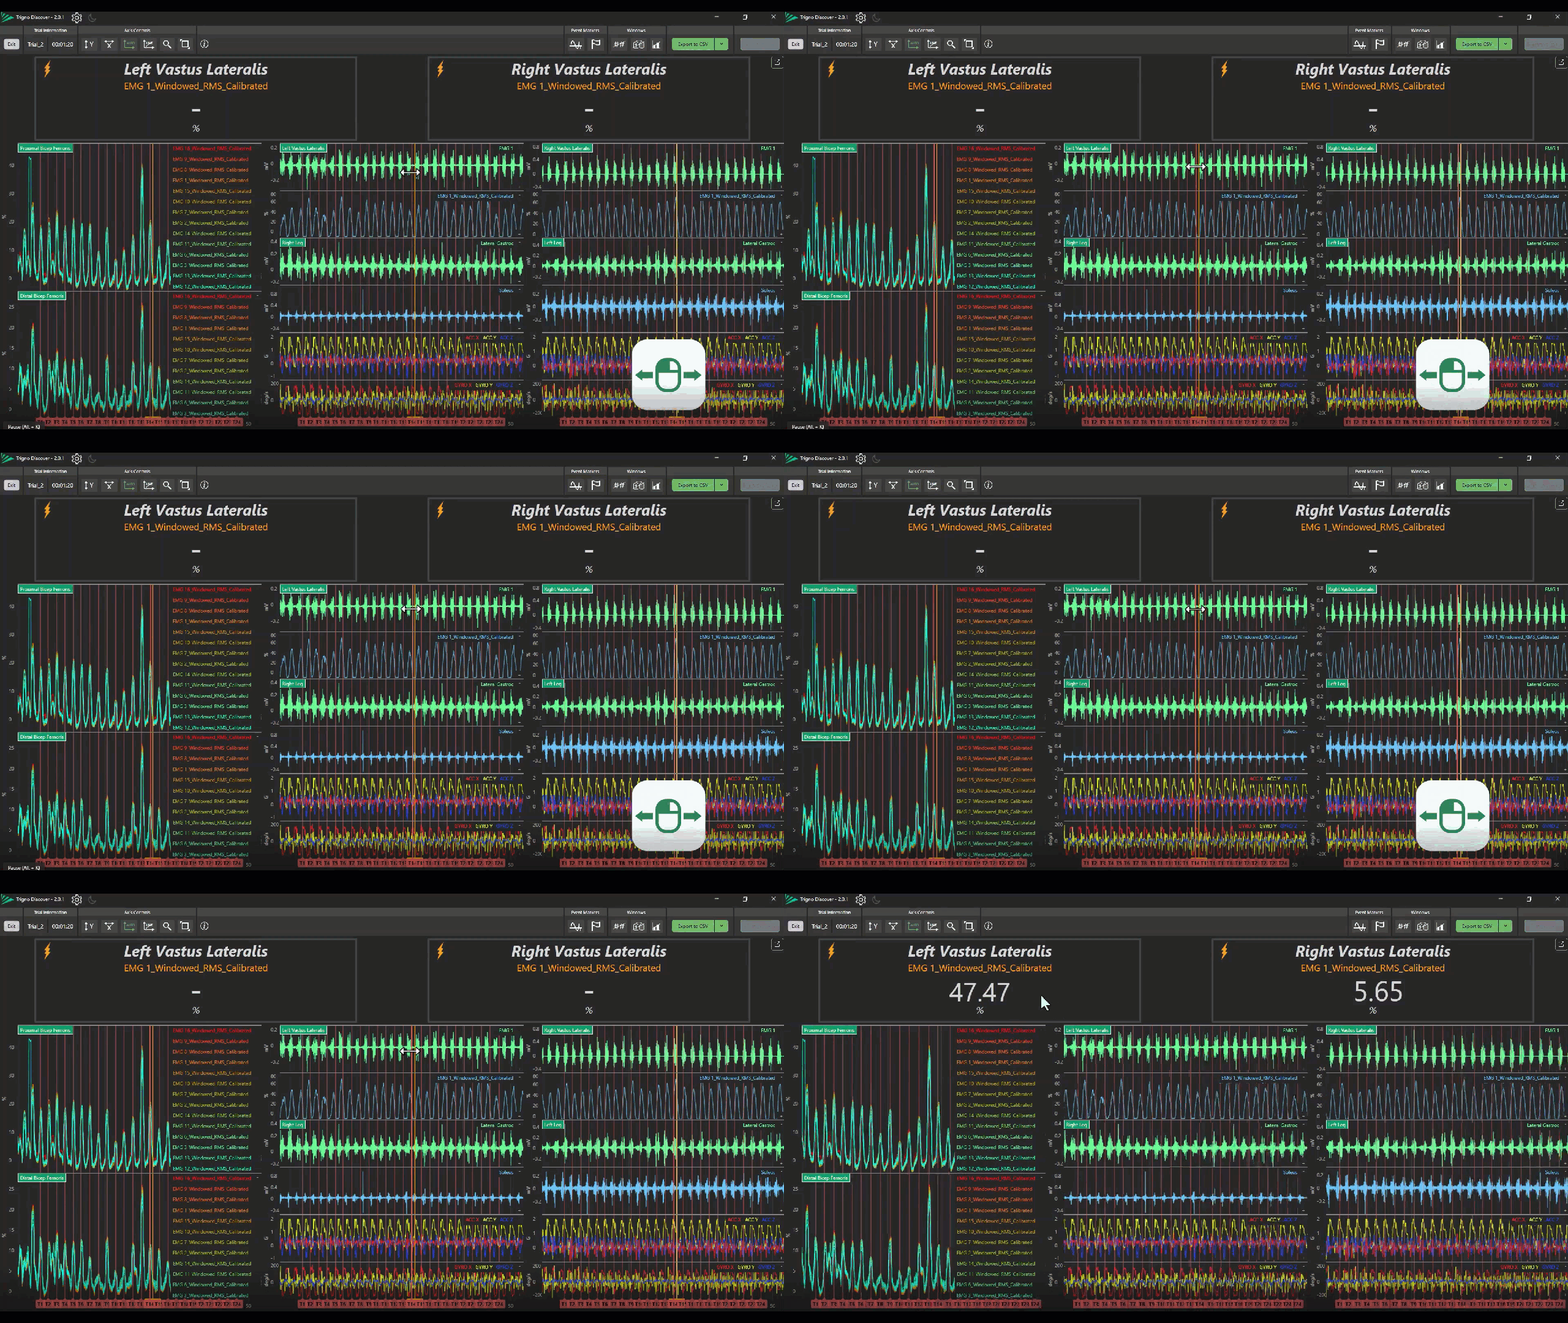
Adjusting Markers
Drag markers along the X-axis to reposition.
Step 6: Event Marker Pane
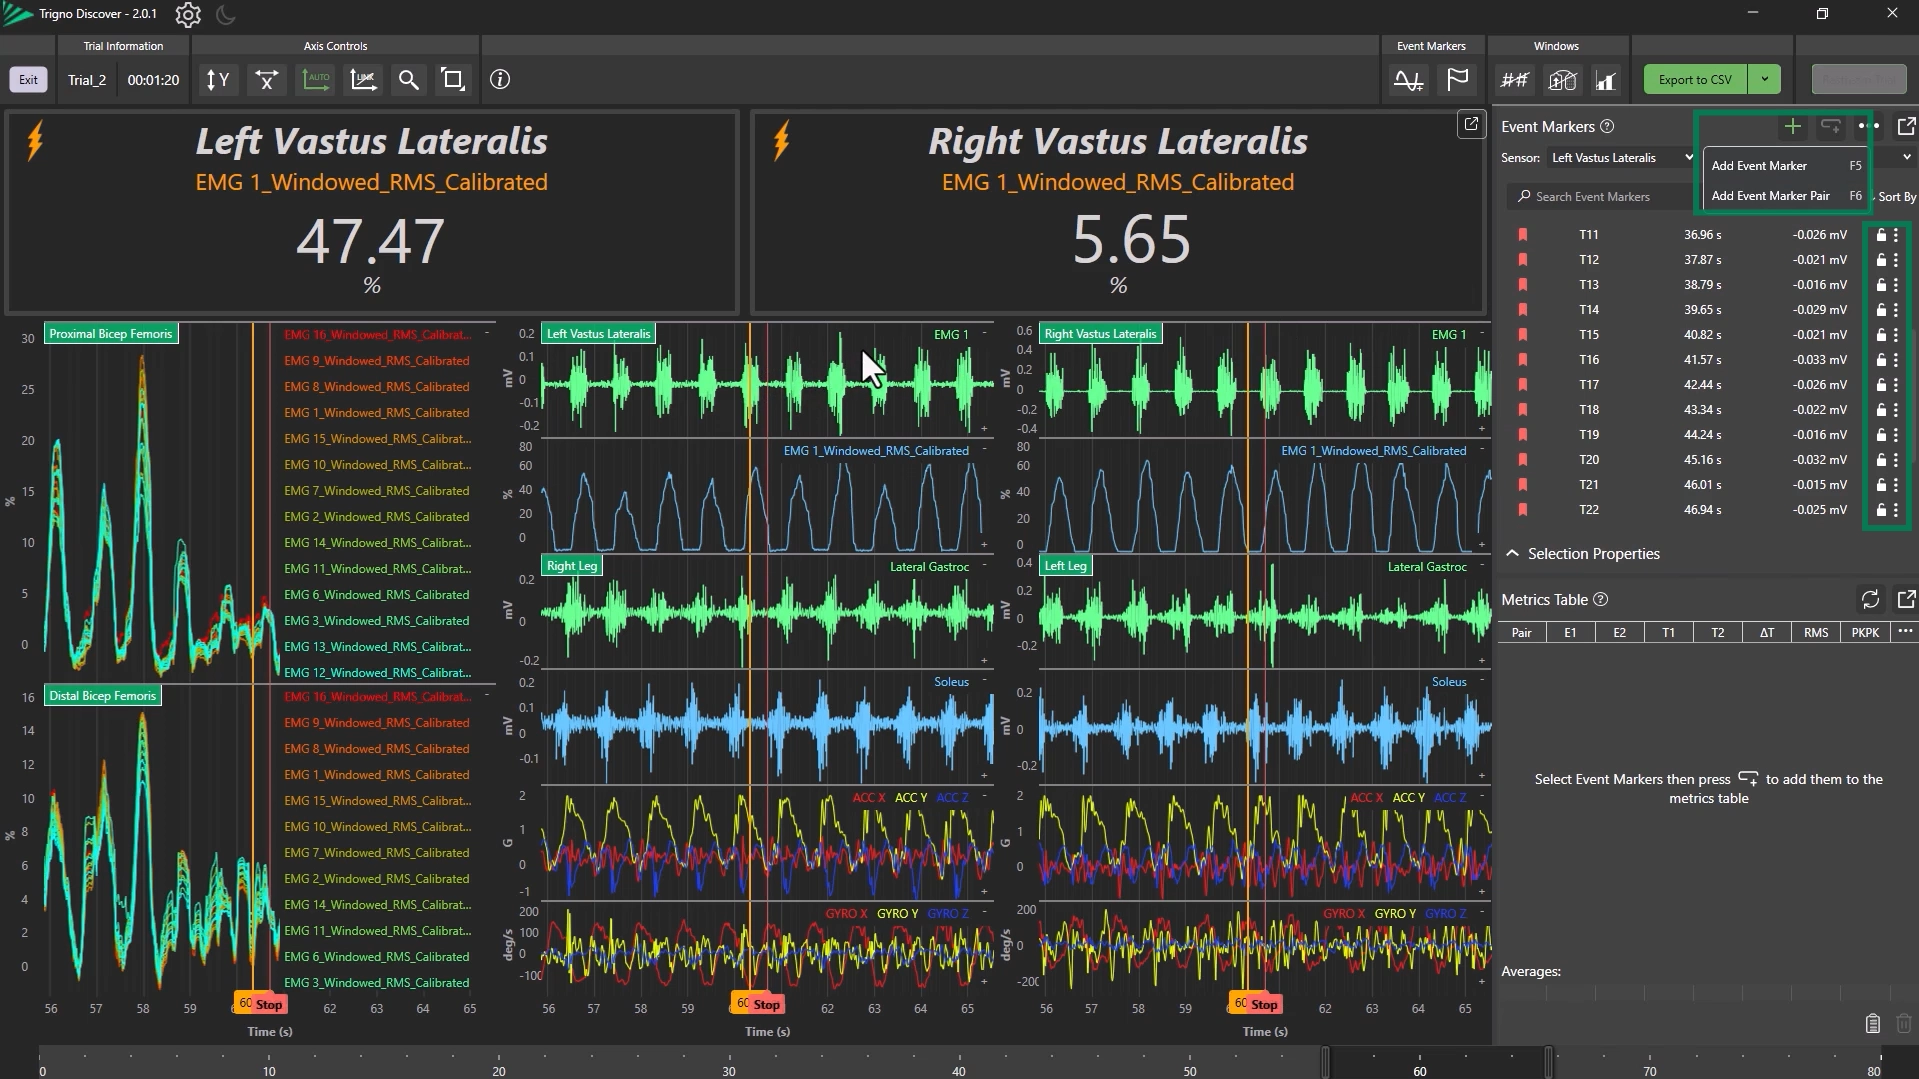
Adding Event Markers from the Event Markers Pane
Open the Event Marker Pane and click “Add Event Marker”.
Choose:
Single Event Marker, or
Event Marker Pairs
Using Shortcuts or Right-Click
Press F5 to drop a single marker.
Press F6 to drop a marker pair.
Or right-click on the data and select the event marker or event marker pair options.
Locking and Unlocking Markers in the Marker Pane
Lock markers using the lock icon to prevent markers from being moved.
Unlock by selecting the unlock icon to re-enable free movement.
Advanced Configuration of Event Markers
Select the ellipsis icon next to the lock icon for an individual event marker.
You can adjust:
Marker color
Channel assignment
Marker visibility
Step 7: Labeling and Describing Event Markers
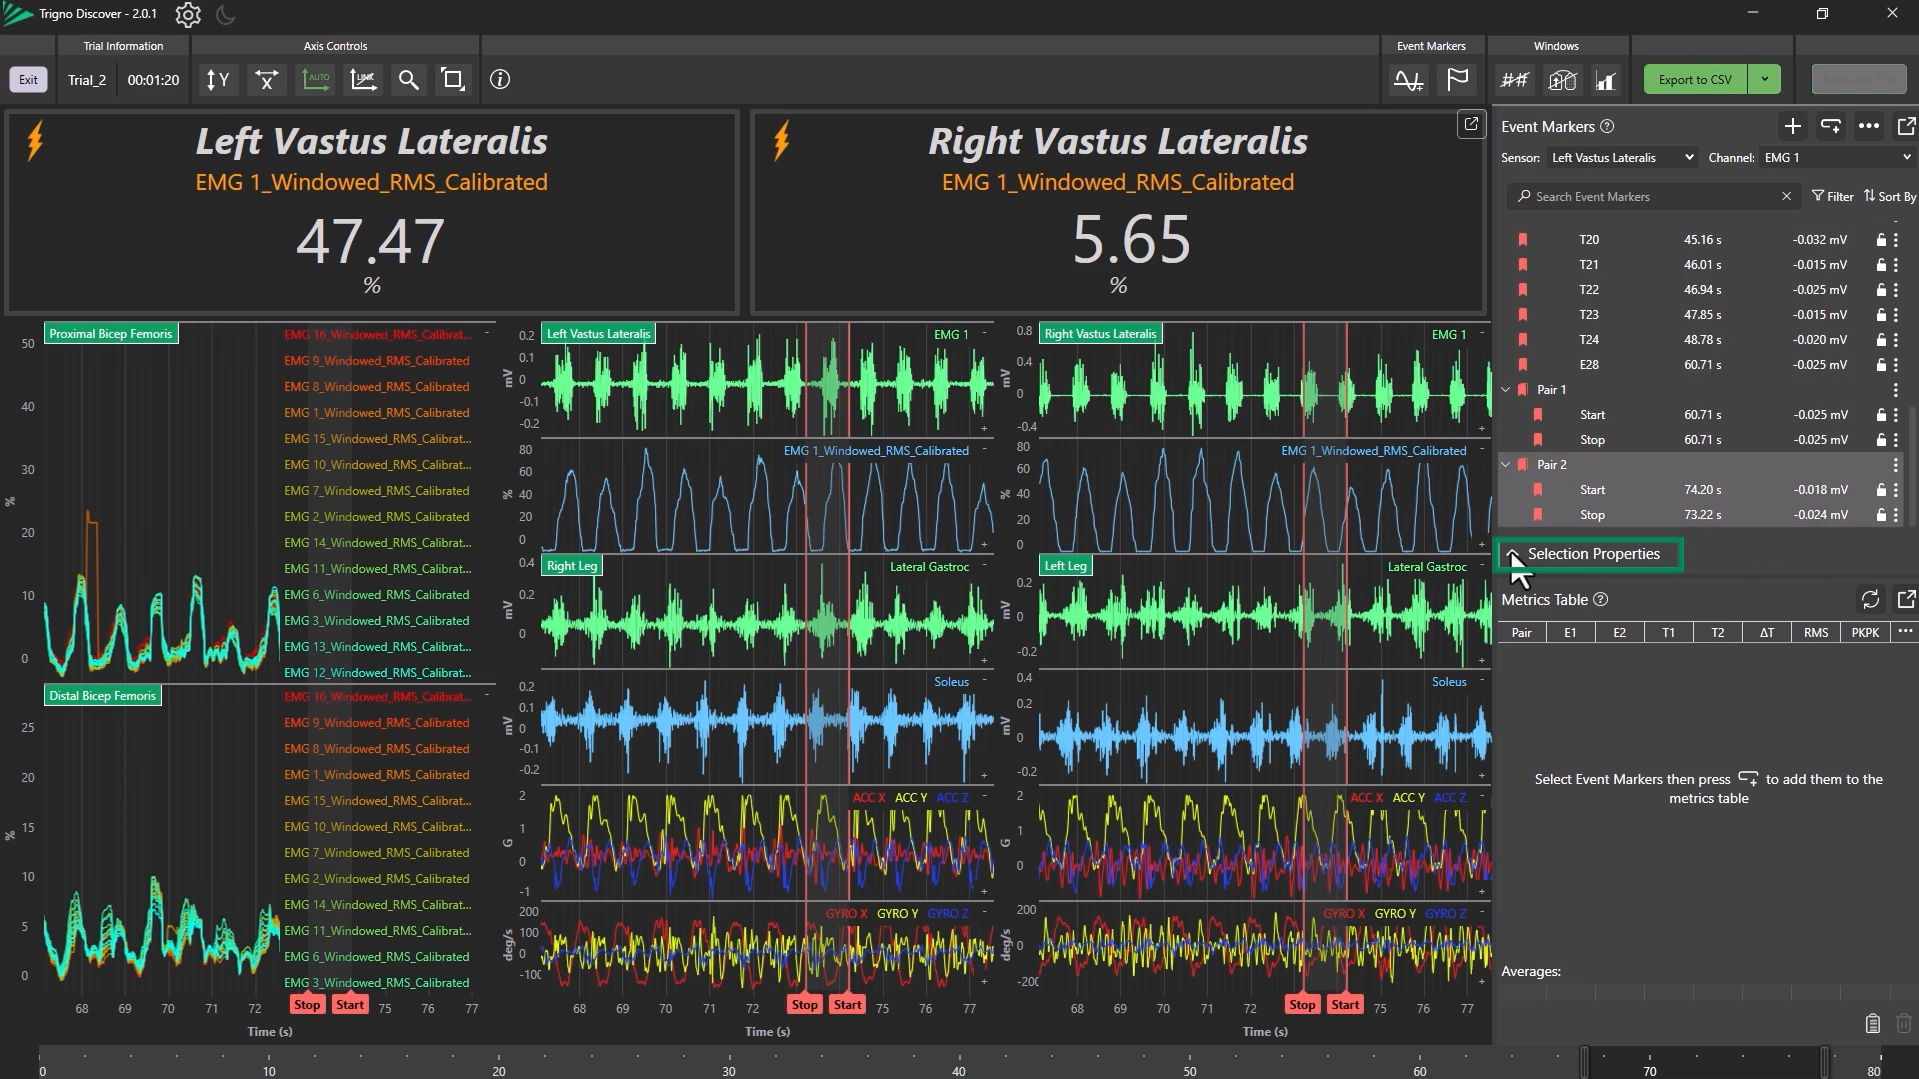
Editing Marker Properties
Select a marker and open Selection Properties.
You can:
Rename the marker
Add a brief description
Assign a tag
Step 8: Managing Marker Pairs
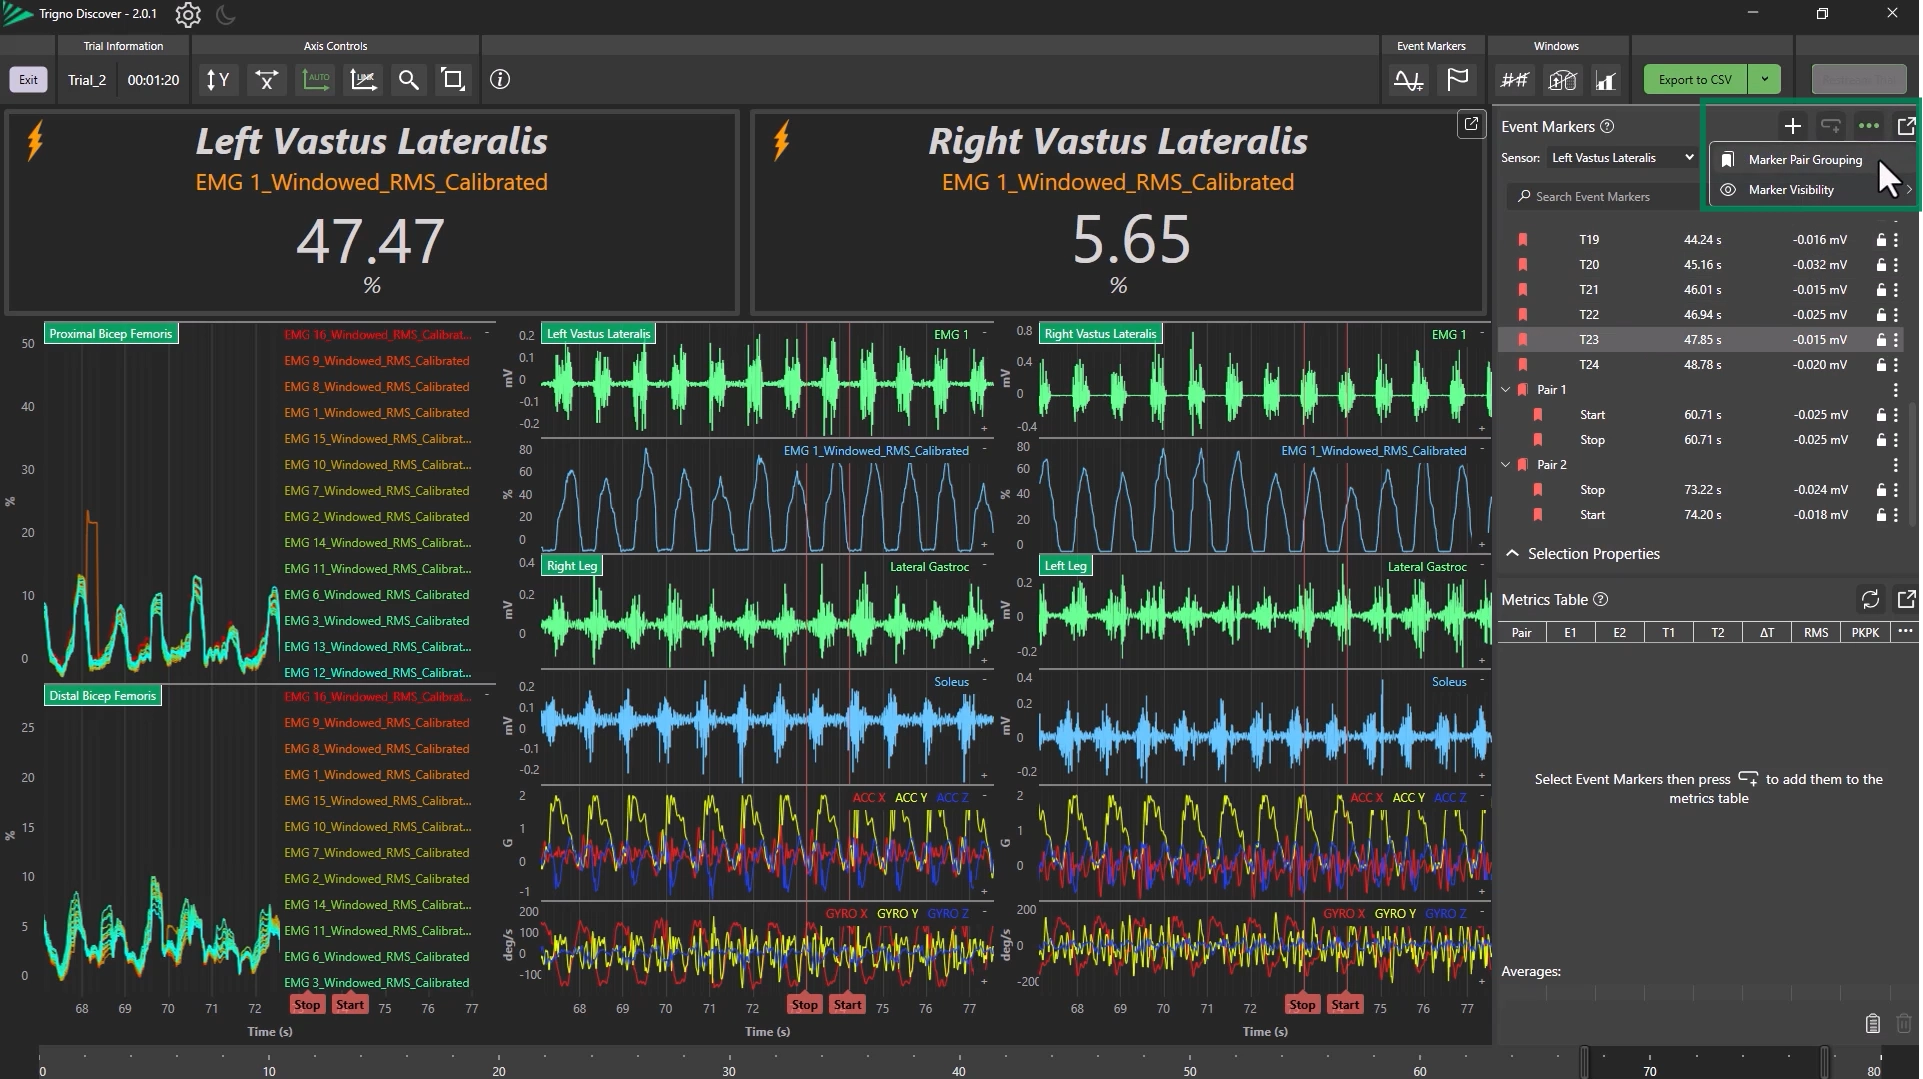
Using the Marker Pair Groupings Menu
Open the menu via the ellipsis (top-right).
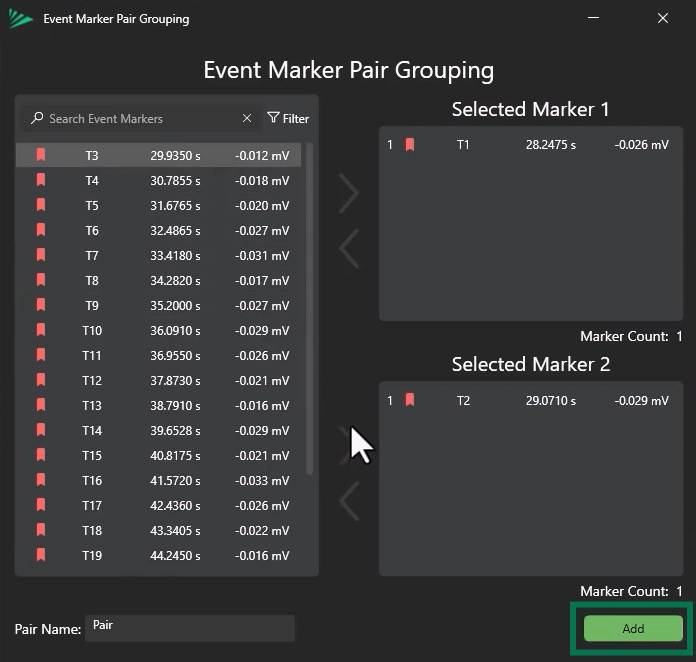
Assign markers to pairs using the arrow buttons.
Markers are paired based on their stack order.
Renaming and Managing Pairs
Rename marker pairs as needed.
Click Add to confirm the pairing.
Information
To be paired, markers will be matched between the Selected Marker 1 and Selected Marker 2 options. Multiple markers can be paired simultaneously, and pairing is done based on their order in the stack.
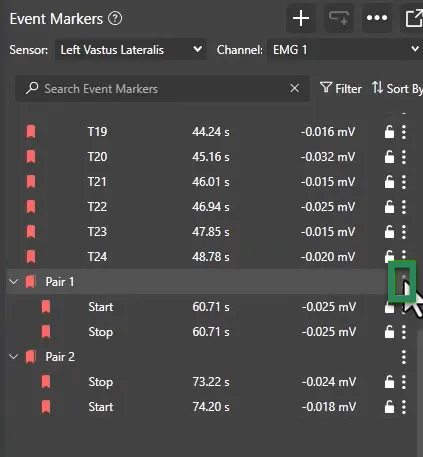
To ungroup:
Click the ellipsis on the pair and choose “Ungroup Pair”.
Step 9: Metrics Table
Adding to Metrics Table
Click the header of multiple single events or a pair and Add to Metrics Table.
This allows for analysis between Data Channels across markers.
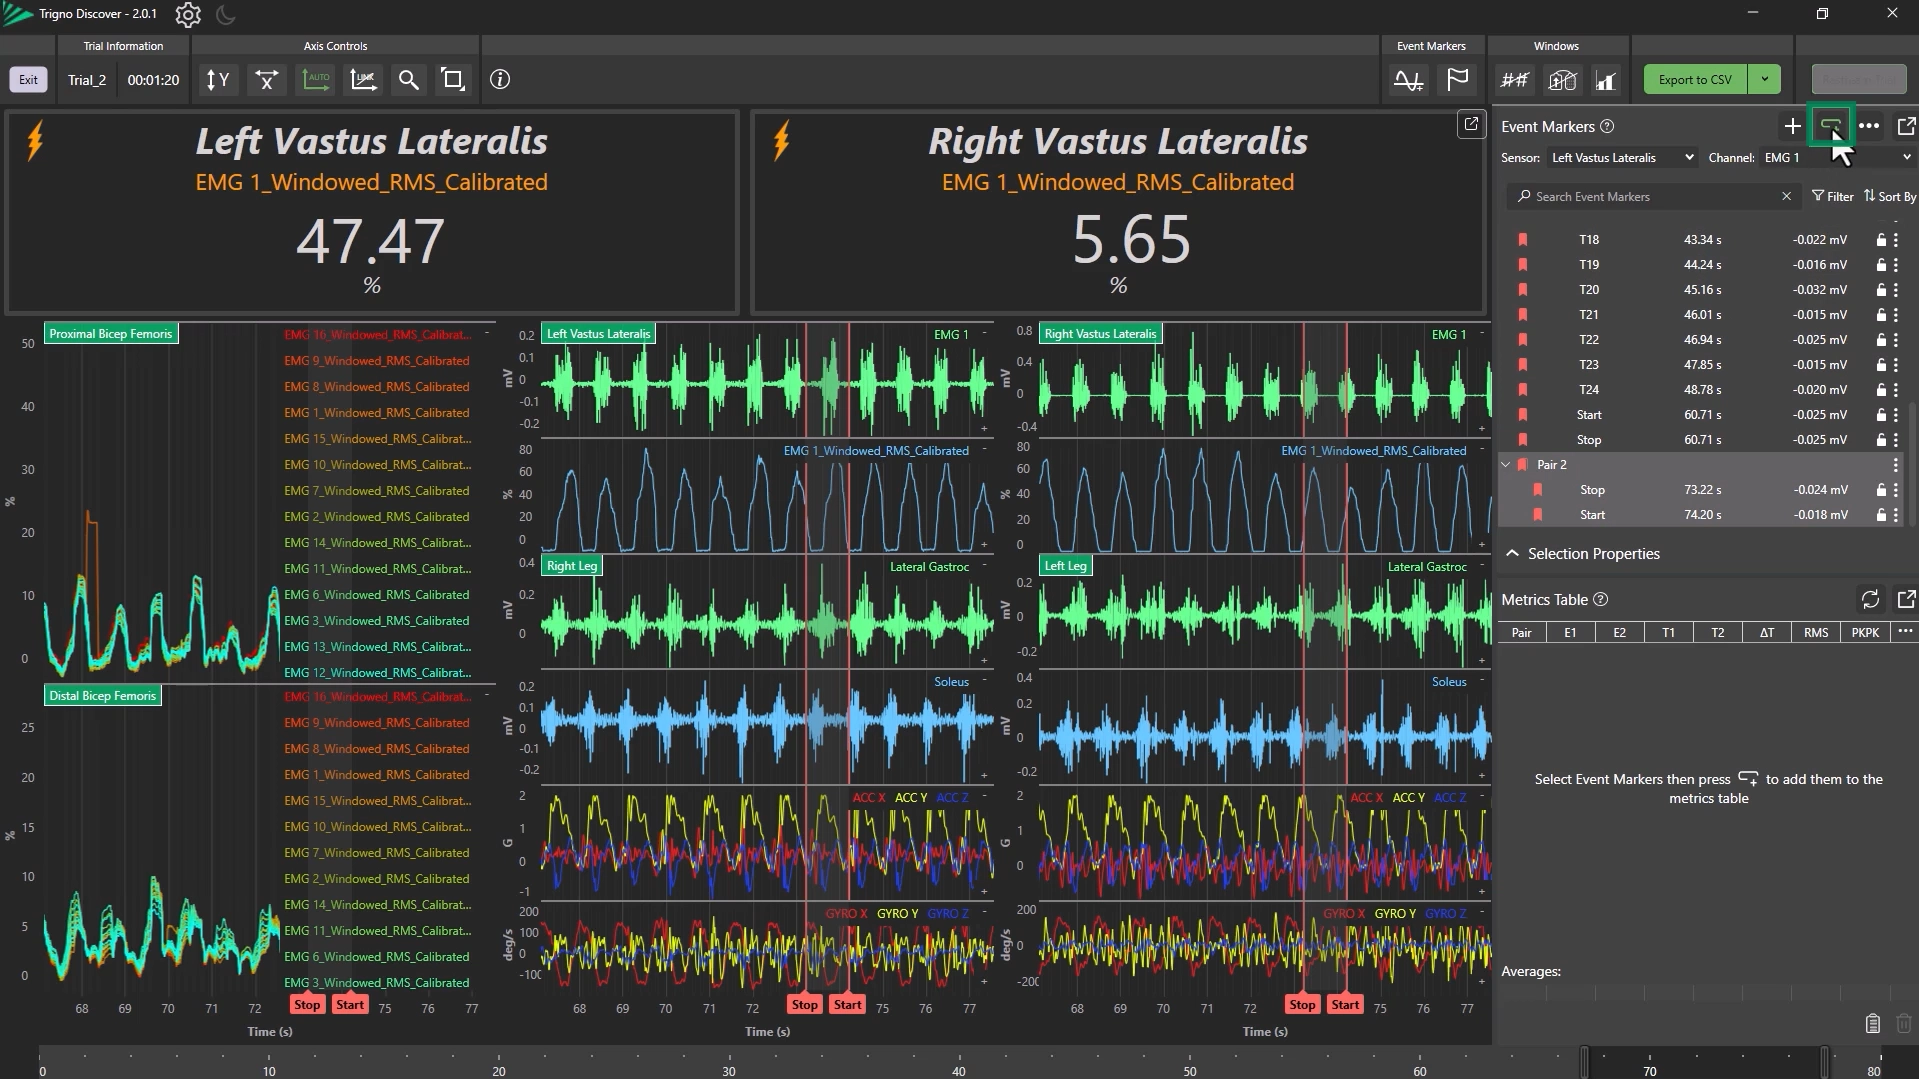
Reviewing Metrics Table
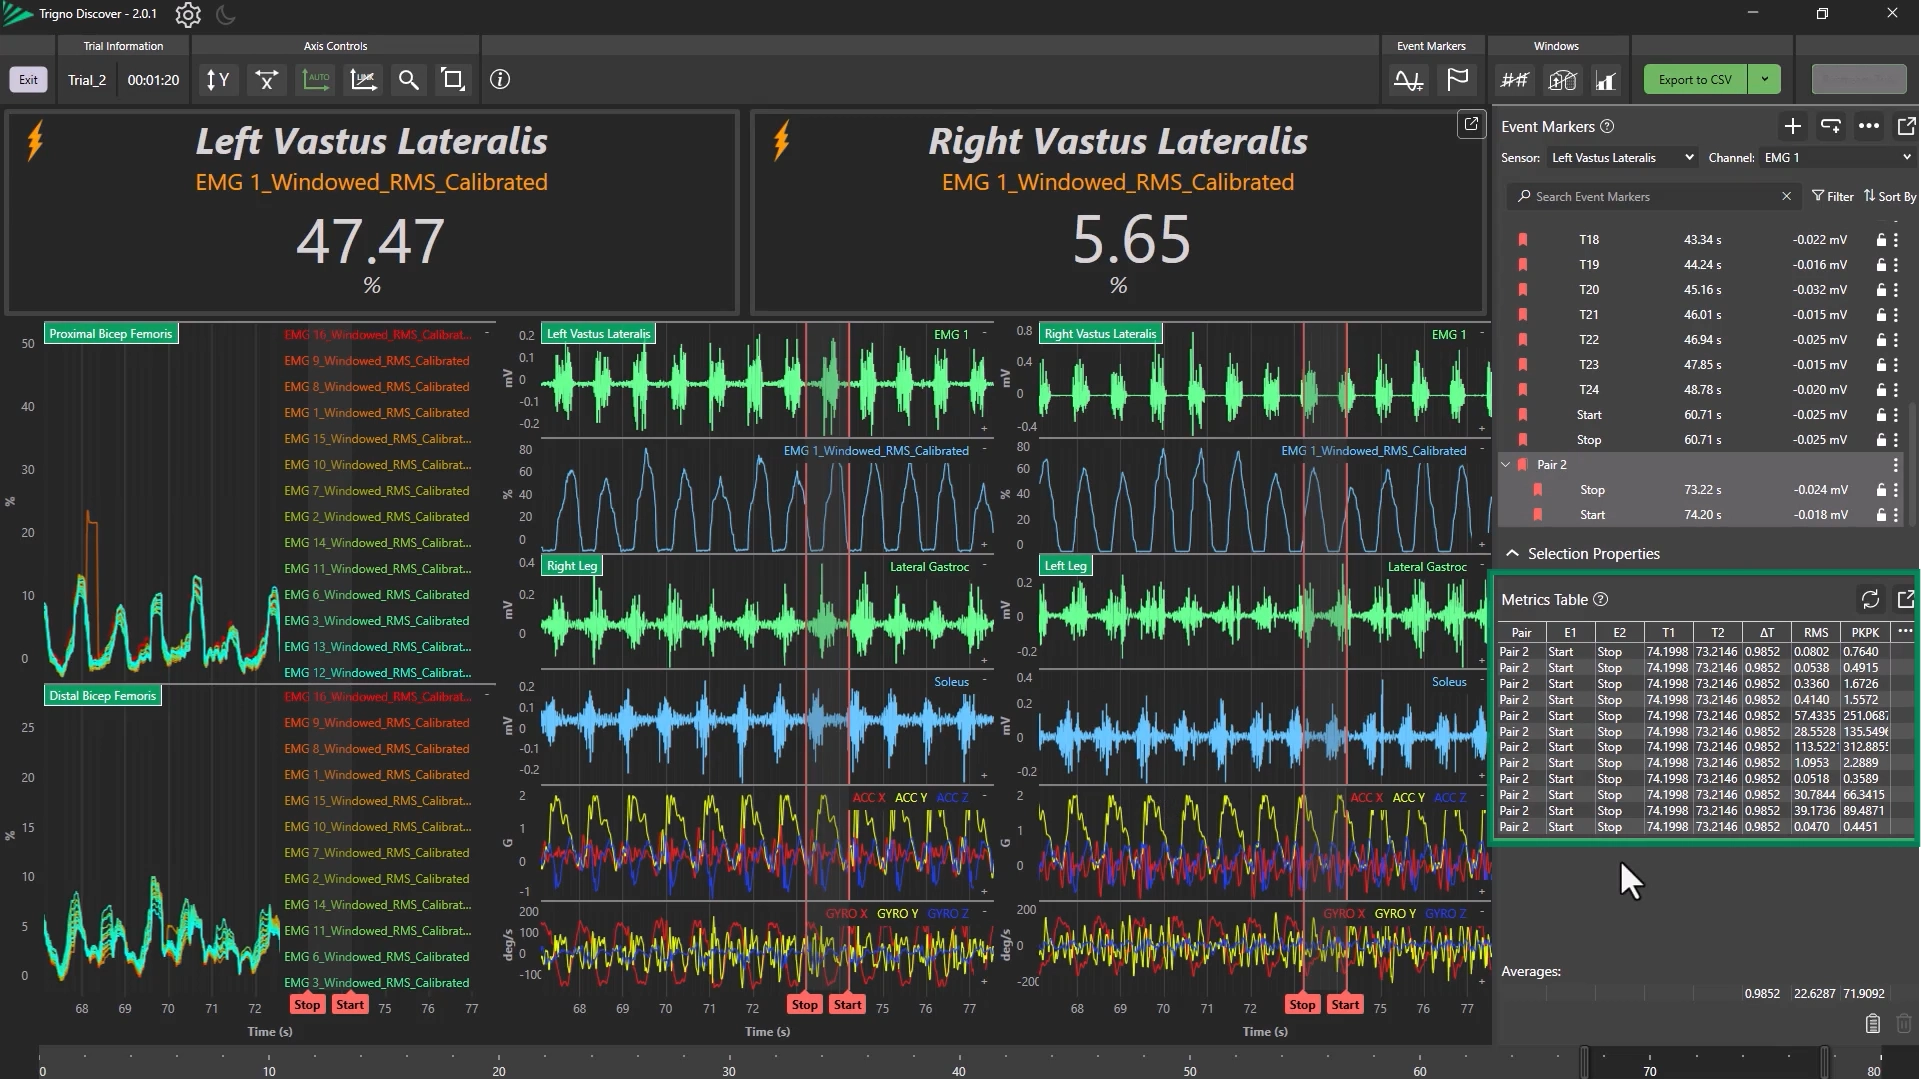
Click Add to populate the table and data will be displayed in the metrics table.
Use the ellipsis to select different metrics.
The pop-out button allows users to pop-out the metrics table.
If marker positions change:
Click Refresh to update data.
Information
The Metrics Table displays selected metrics between event marker pairs. Be sure to click Refresh after moving markers to ensure the data is up to date.
Step 10: Exporting Marker Data
Copying or Exporting Data
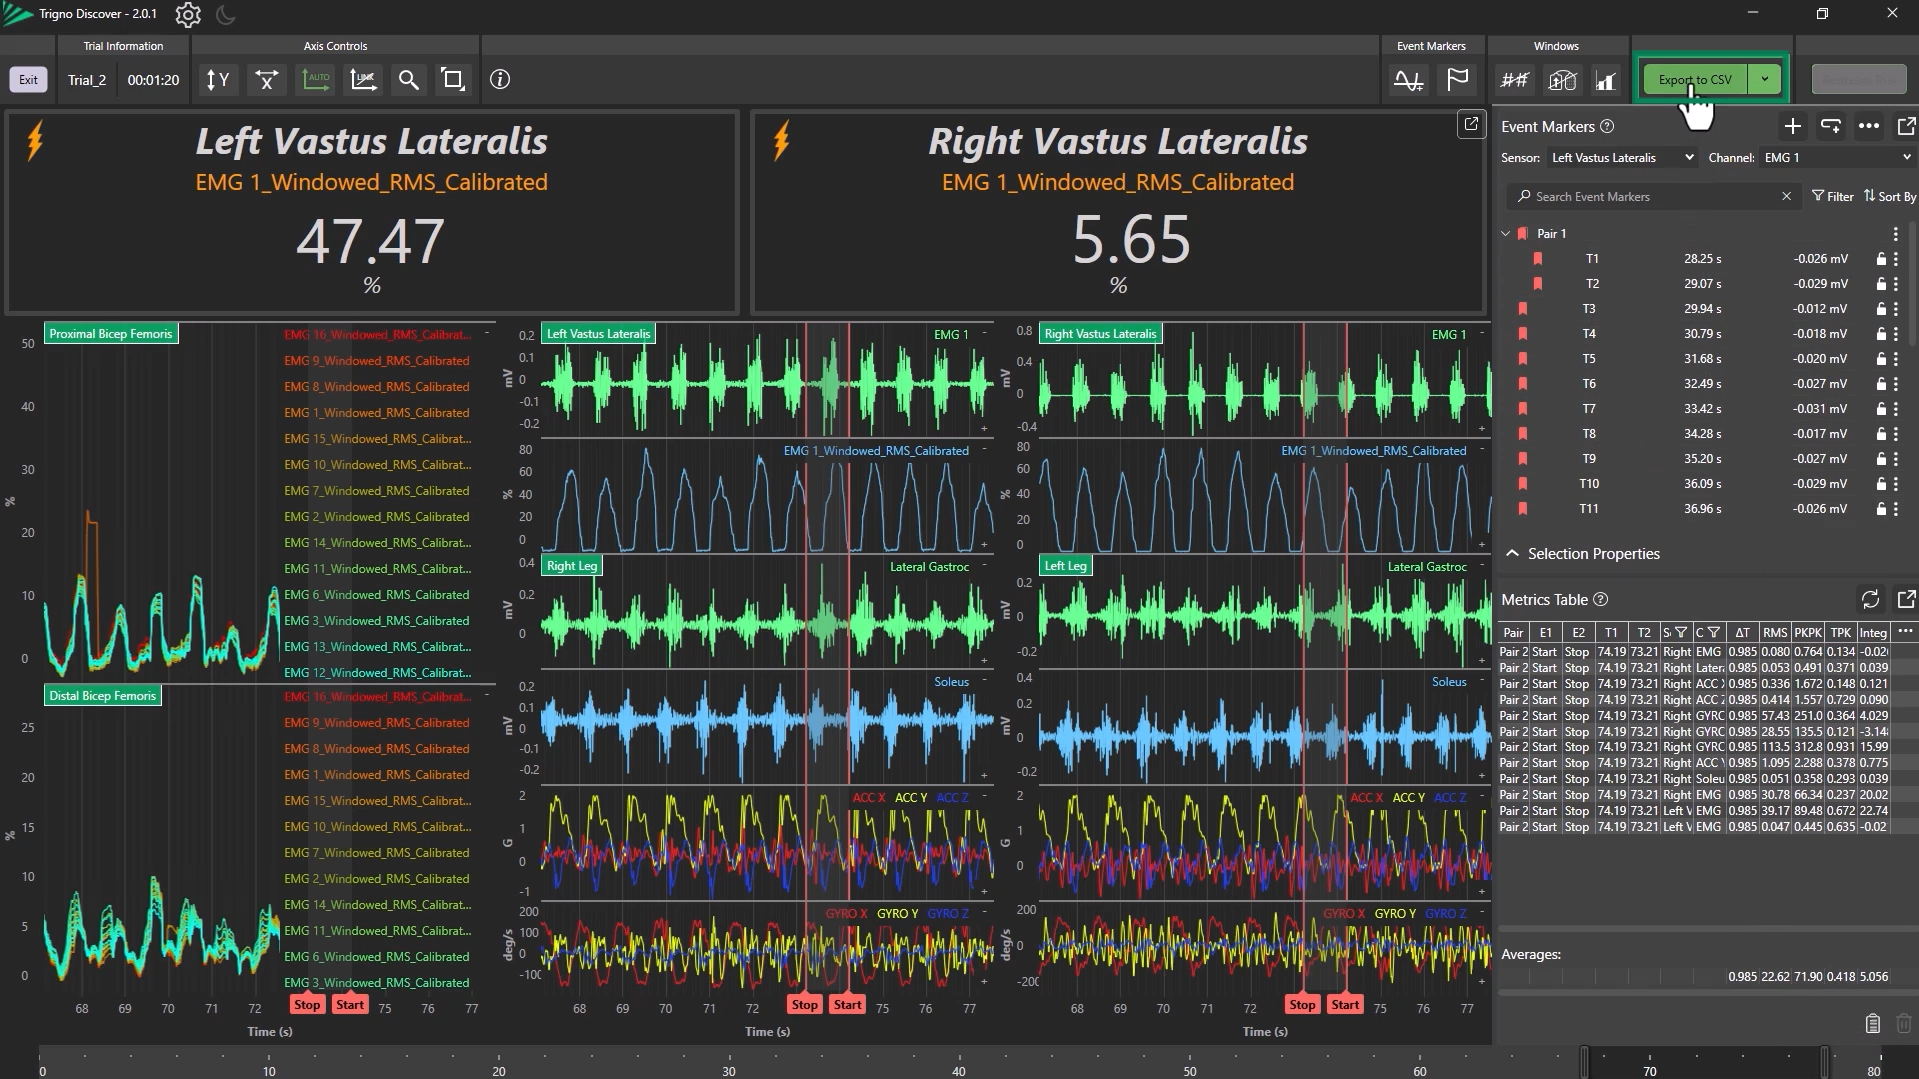
Use the clipboard icon to copy the table.
The Metrics Table data can be exported using the Export to CSV tool.
For more information on Trigno Discover, please refer to the next article in the Trigno Discover Getting Started Series: Trigno Discover: Advanced Export.
DOC-678-1-0
.png)

