Overview
This guide walks through the preparation steps required for generating reports in Trigno Analytics. Trigno Analytics operate on user-defined events within the data, meaning that event markers are essential for identifying repetitions or regions of interest. This guide will cover how to set up sensors, perform MVC calibrations, collect high-quality data, and apply event markers during or after recording. The guide also outlines how proper preparation ensures accurate, consistent, and reliable inputs for Trigno Analytics, enabling meaningful comparisons across muscles, exercises, and movement cycles.
Information
This article refers to Trigno Discover version 2.1. Please note that the user interface may vary depending on the version you have installed. You can find your current version of Trigno Discover in the top left corner of the application window.
System Requirements
Material/Tool | Description |
|---|---|
Software | Trigno Discover 2.1.0.7+ |
Hardware: System | Trigno Centro; Trigno Lite; Trigno Research Base Station |
Firmware: System | Trigno Centro: 06-05-00 | 04-01 + Trigno Lite: 02-02 + Trigno Research Base Station: Digital: 2919 | 1506 | 0806 | 2008 | 0000 Analog: 2919| 1506 | 0806 | 2008| 0901 |
Hardware: Sensors | Avanti-Style Sensors |
Firmware: Sensors | Avanti-Style Sensor: 40-49 Maize Sensor: 60-29 |
Operating System | Windows 11 |
PC Specifications |
|
Step-by-Step Instructions
Step 1: Add Sensors to Trigno Discover
For detailed instructions, please refer to Activating & Pairing a Sensor to learn more about how to add sensors to Trigno Discover.
Activate the sensor by tapping it on the magnet until the LED turns orange/cyan.
In Trigno Discover, click Add Sensor, enter the sensor number, then tap the sensor on the magnet.
If a sensor has been paired previously, a manual scan can be initiated by selecting “Scan for Sensors.”
Information
The recommended number of muscles depends on the report type:
Cyclical Analysis: 1, 2 or 4 muscles
Symmetry Analysis: 2 muscles
Amplitude Analysis: 3-8 muscles
Co-Activation Analysis: 2 muscles
Step 2: Trial Set Up
For detailed instructions, refer to Trigno Discover: Trial Setup to learn more about how to configure a trial.
Adjust the Sensor Name, mode, sampling frequency, and bandwidth through the display in the connected sensors window or through the sensor Settings Icon.
Edit trial settings, including trial name, tags, and comments.
Modify timed and delayed collection settings if required.
Enable biofeedback through the Plot Configuration tab.
Preview Signals before starting data collection by selecting Preview Signals to verify signal quality.
Information
Data collected during the preview is not saved.
Step 3: Perform MVC Calibration (Optional)
For detailed instructions, refer to Trigno Discover: MVC Calibrations to learn how to perform an MVC calibration.
Information
Performing an MVC calibration allows the following:
Biofeedback plots (bar charts or number displays) to be added
Multiple trials in a session to be normalized against the same reference task
Live EMG to be displayed as a calibrated RMS trace expressed as a percentage of MVC
Performing MVC at the start of a data session is the gold standard, but you may normalize post-collection, if desired. Choose either pre-collection MVC calibration or post-collection normalization; if post-collection normalization is preferred, skip Step 3.
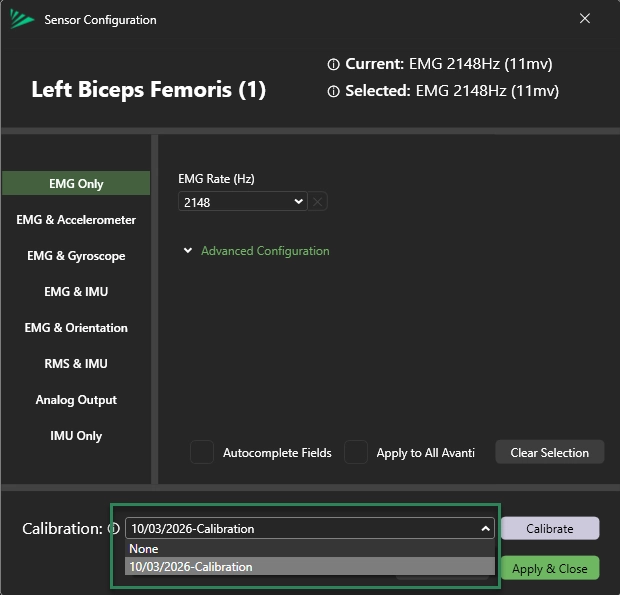
Access Calibration by clicking the Settings Icon of the sensor you wish to calibrate.
Information
Calibration is sensor and mode specific; changing sensors or configuration modes requires a new calibration.
Calibration can only be performed on one sensor at a time.
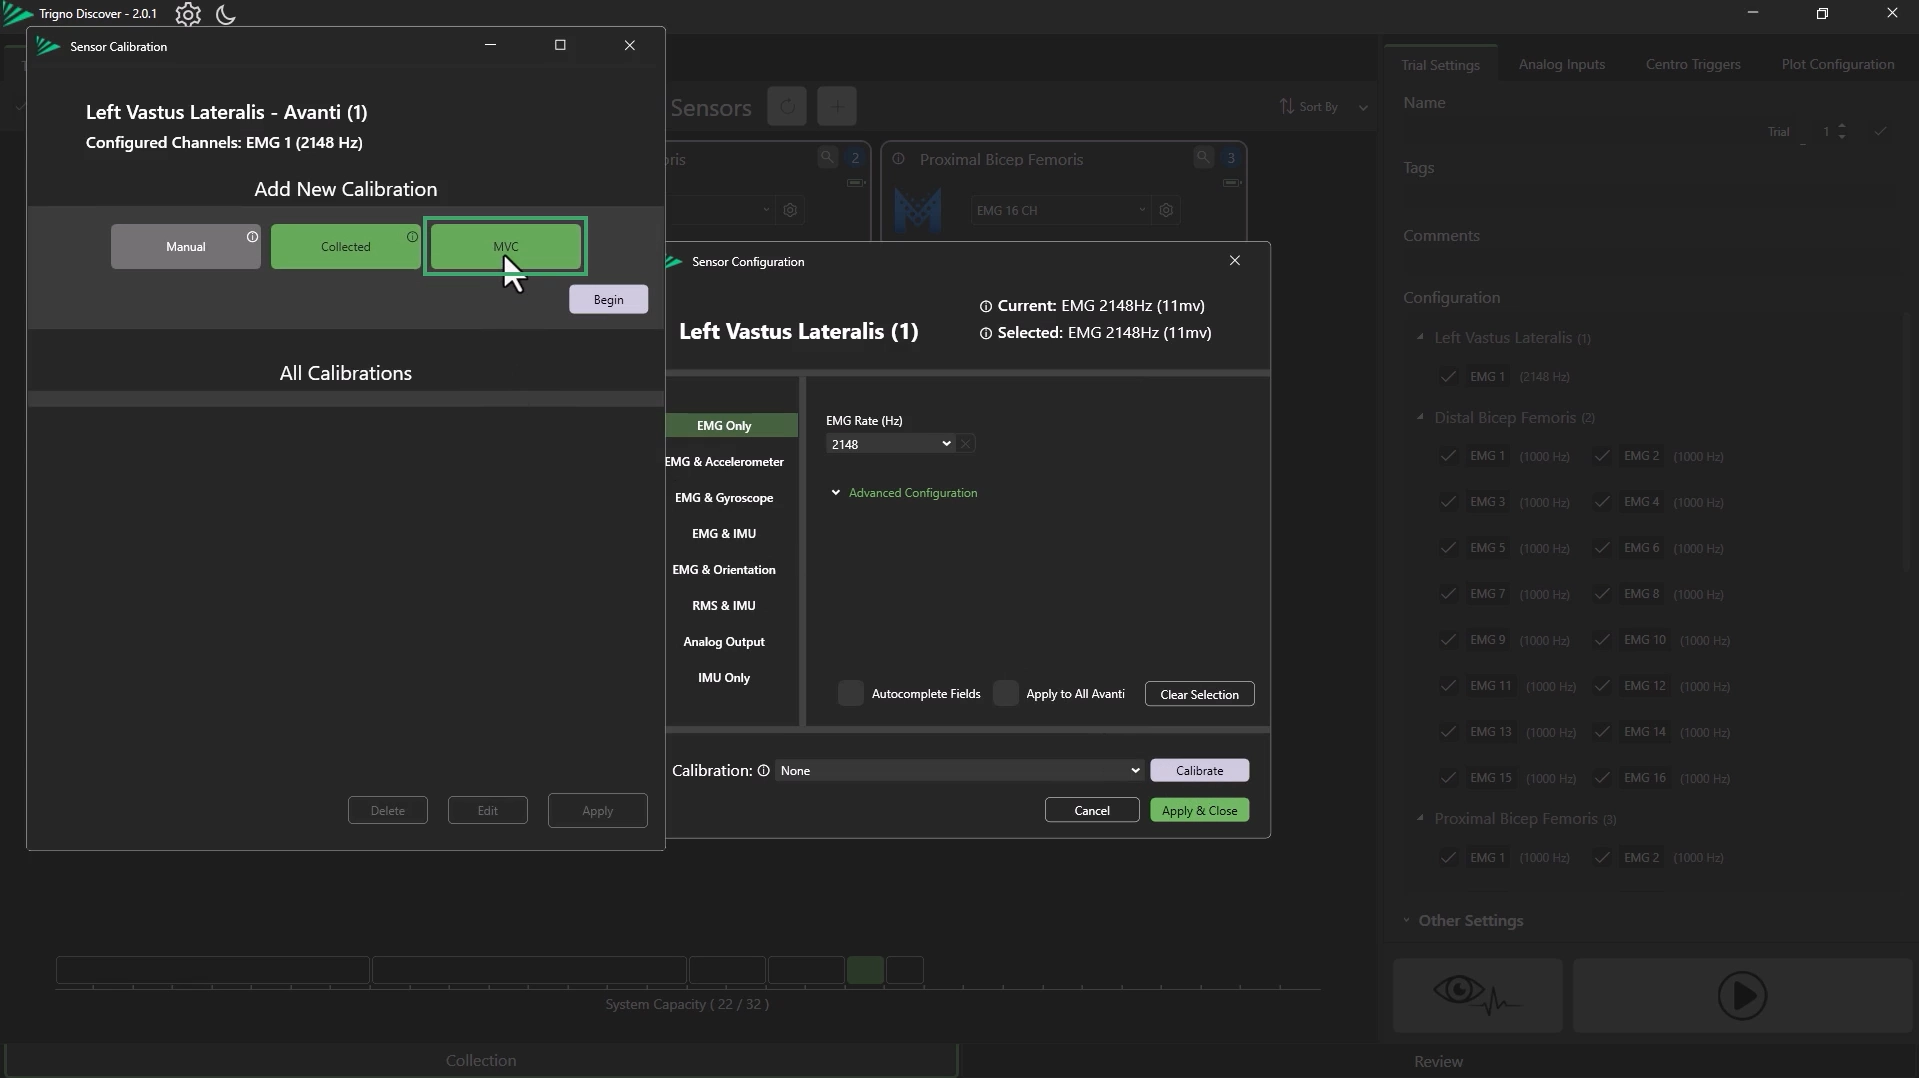
Start MVC Calibration:
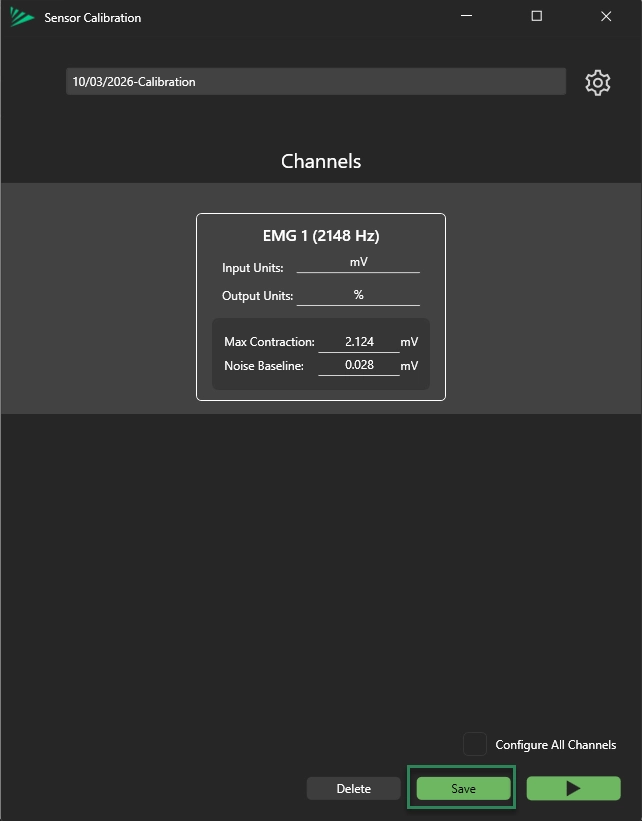
Click Calibrate to open the Sensor Calibration Panel.
Select MVC Calibration from the options.
Click Begin.
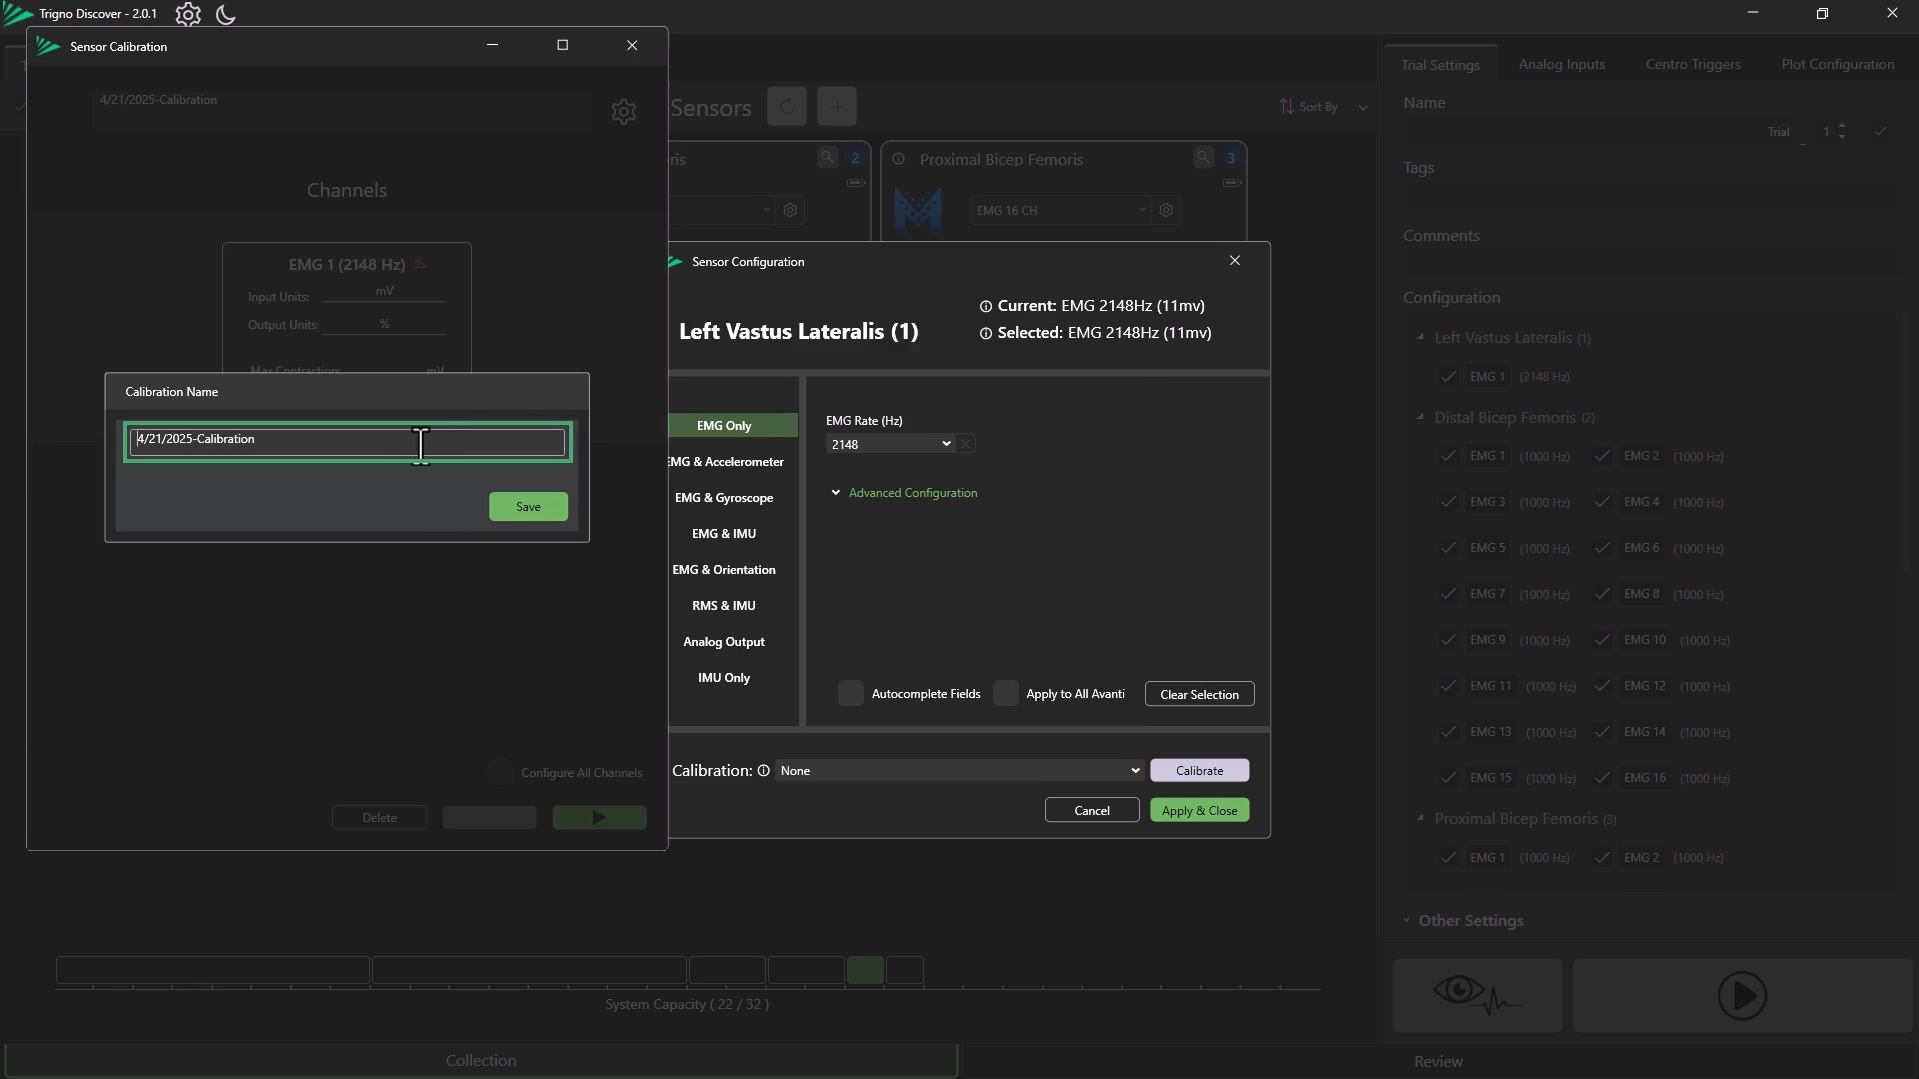
Rename the calibration (optional), then click Save.
If multi-headed sensors are being used, enable Configure All Channels to calibrate all EMG channels.
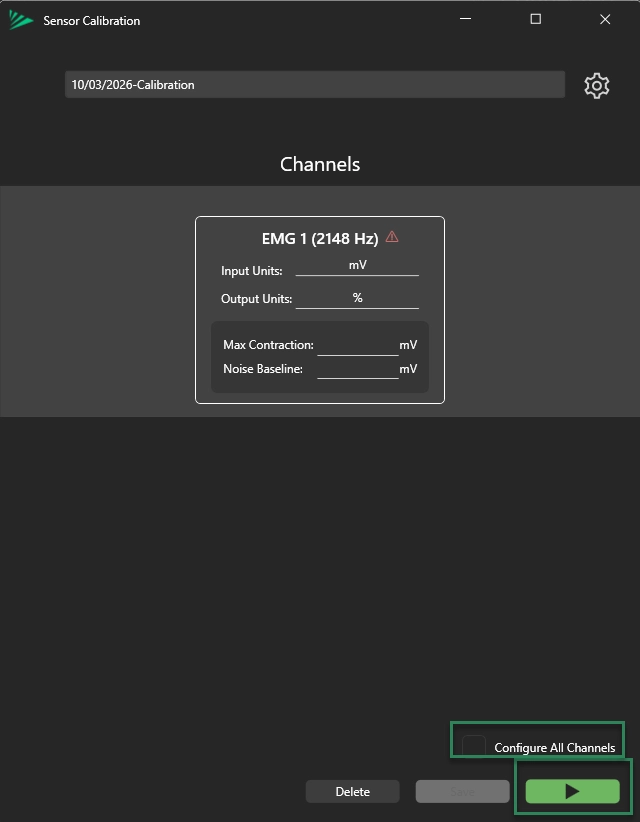
Select “Start Collection” to begin the calibration process.
Information
Ensure maximum effort during contractions and full relaxation during rest for best results.
Save or Repeat:
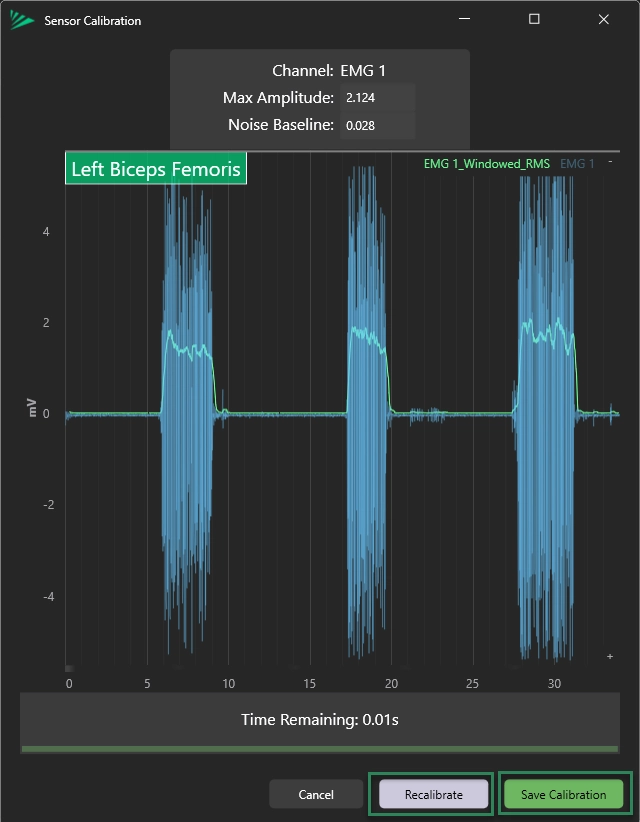
Once the trial completes, click Save Calibration.
If data quality is poor or effort was submaximal, click Recalibrate to repeat the process.
Apply Calibrations
Select the Save option, and this will automatically apply the calibration.
To select another calibration, open Sensor Settings Icon and use the calibration drop-down menu to choose your saved calibration.
Click Apply & Close to confirm.
Step 4: Data Collection
For detailed instructions, refer to Trigno Discover: Data Collection & Review to learn more about how to collect data
Start Collection by clicking Start Collection:
Suggestion
There is no minimum number of movement repetitions required for Trigno Analytics.
Performing a maximal contraction at the start of data collection is recommended to provide a reference for normalization if MVC Calibration is not performed in Step 3.
Event Marking during data collection (Optional)
Press the F5 key or right-click in the plot area and select to add an event.
Press the F6 key to add an event marker pair.
Click and drag the event marker to reposition it.
Suggestion
Use a single marker when users want to include all collected data without excluding any portion. E.g., continuous or cyclical movements (e.g., walking or running), where muscle activation occurs throughout the entire activity and all data is relevant for analysis.
Use paired markers when users want to exclude certain parts of the data. E.g., when multiple jumping trials are recorded with rest periods in between. Paired markers can be used to isolate each exercise and ignore the resting periods.
Information
Event markers can be created during or after data collection
For more information on data plotting shortcuts, hover over the “i” icon in the toolbar.
Stop Collection and Review Data:
Click the Stop button to end the trial.
After stopping, the complete trial data becomes available for review.
Step 5: Post- Collection Normalization (Optional)
This section explains how to apply a post-collection normalization when an MVC calibration was not performed or when normalization is needed to generate Trigno Analytics reports.
Information
To access previously collected data for post-collection normalization, navigate to the Review tab in Trigno Discover, select the desired file from the list, and click Review to open it.
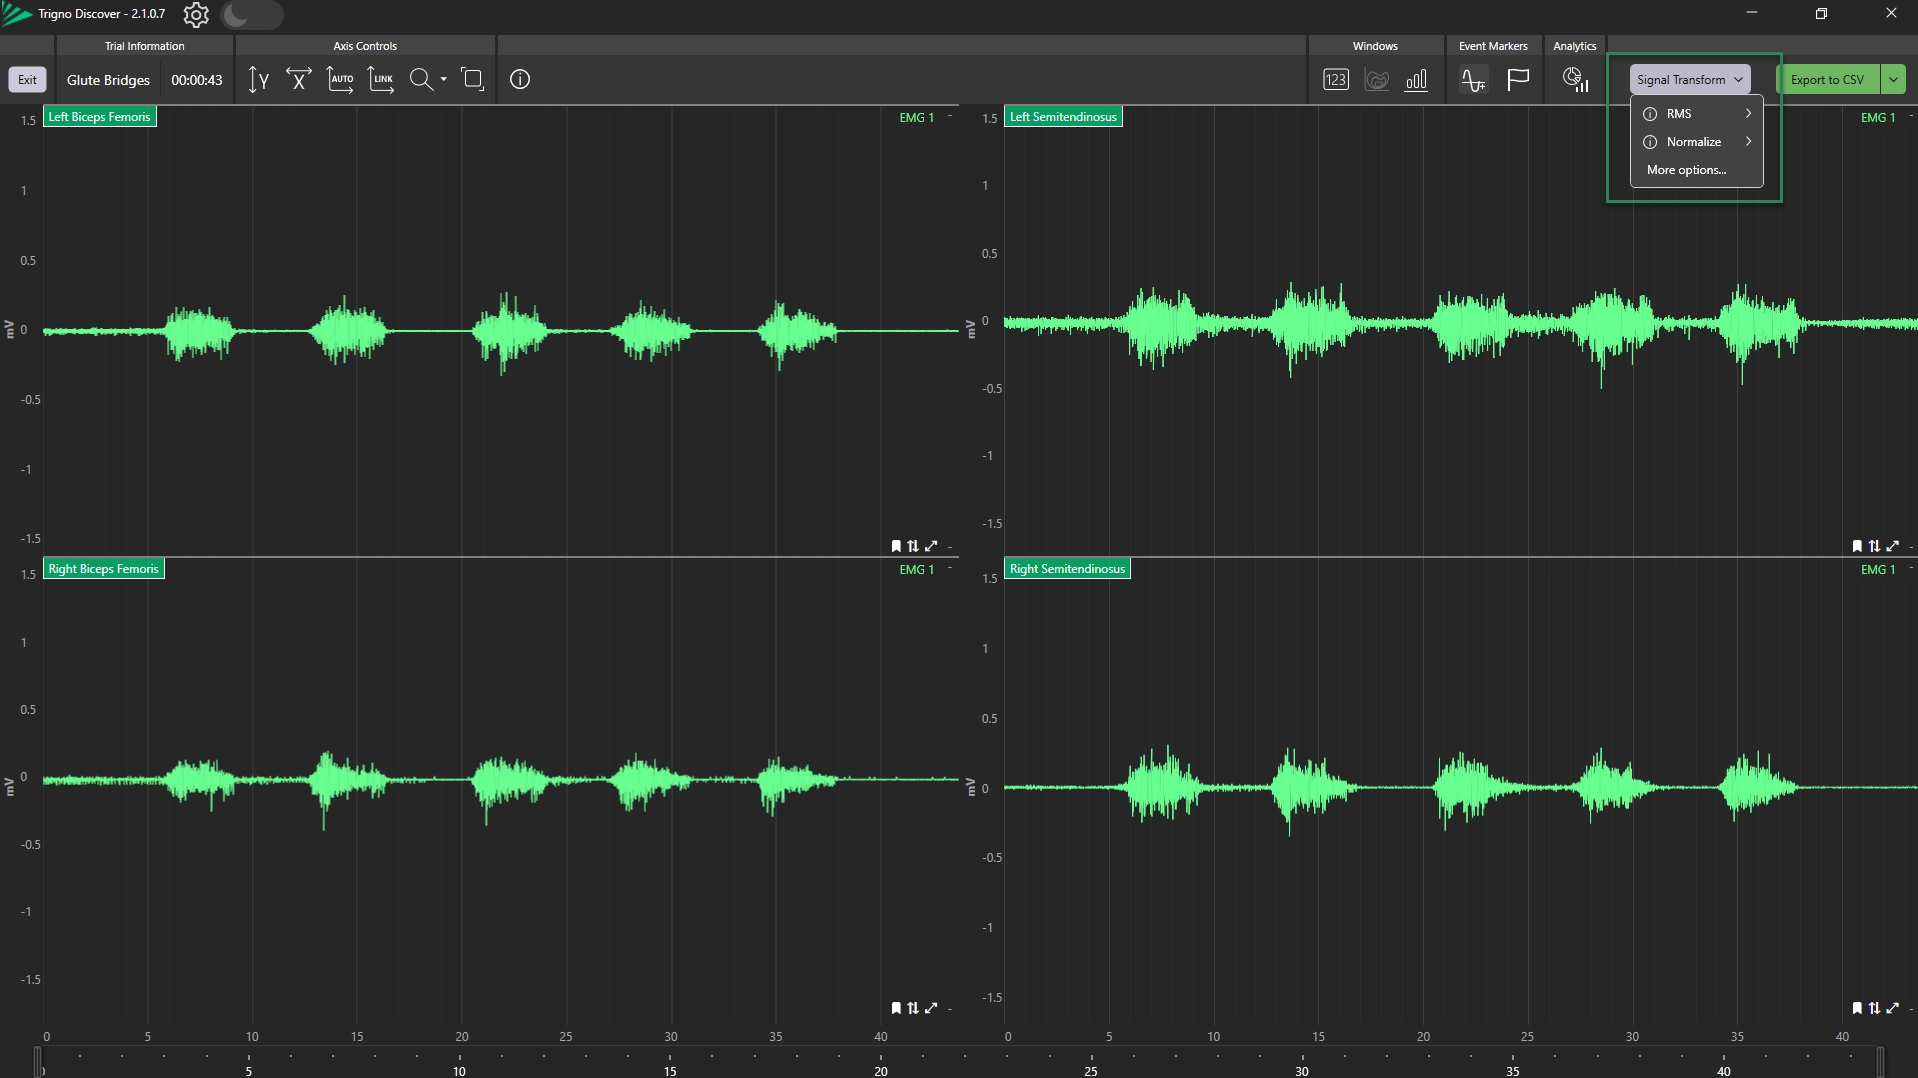
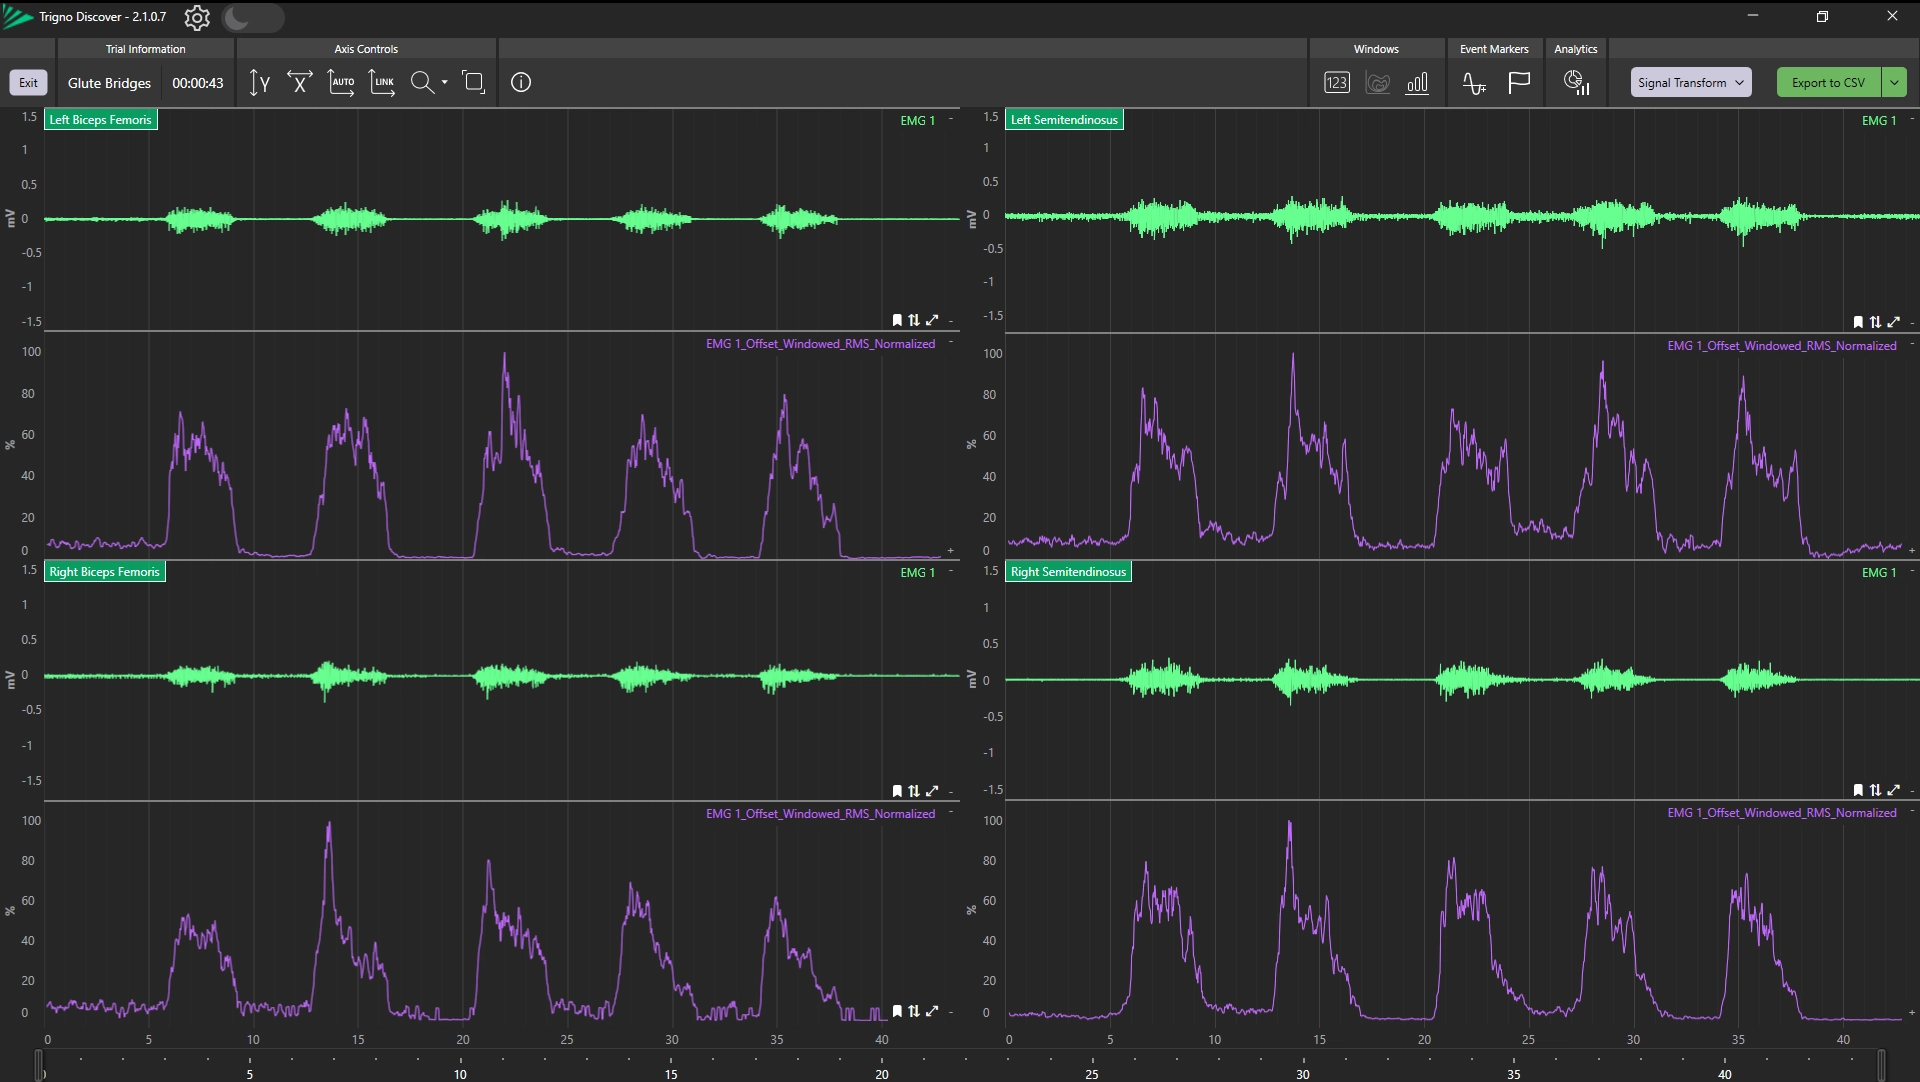
Click the Signal Transform button and select Normalize to apply a normalization transform.
Information
Normalization applies an RMS filter to the raw EMG channels, identifies the peak value for each resulting RMS signal, and then expresses all EMG data as a percentage of these peak values.
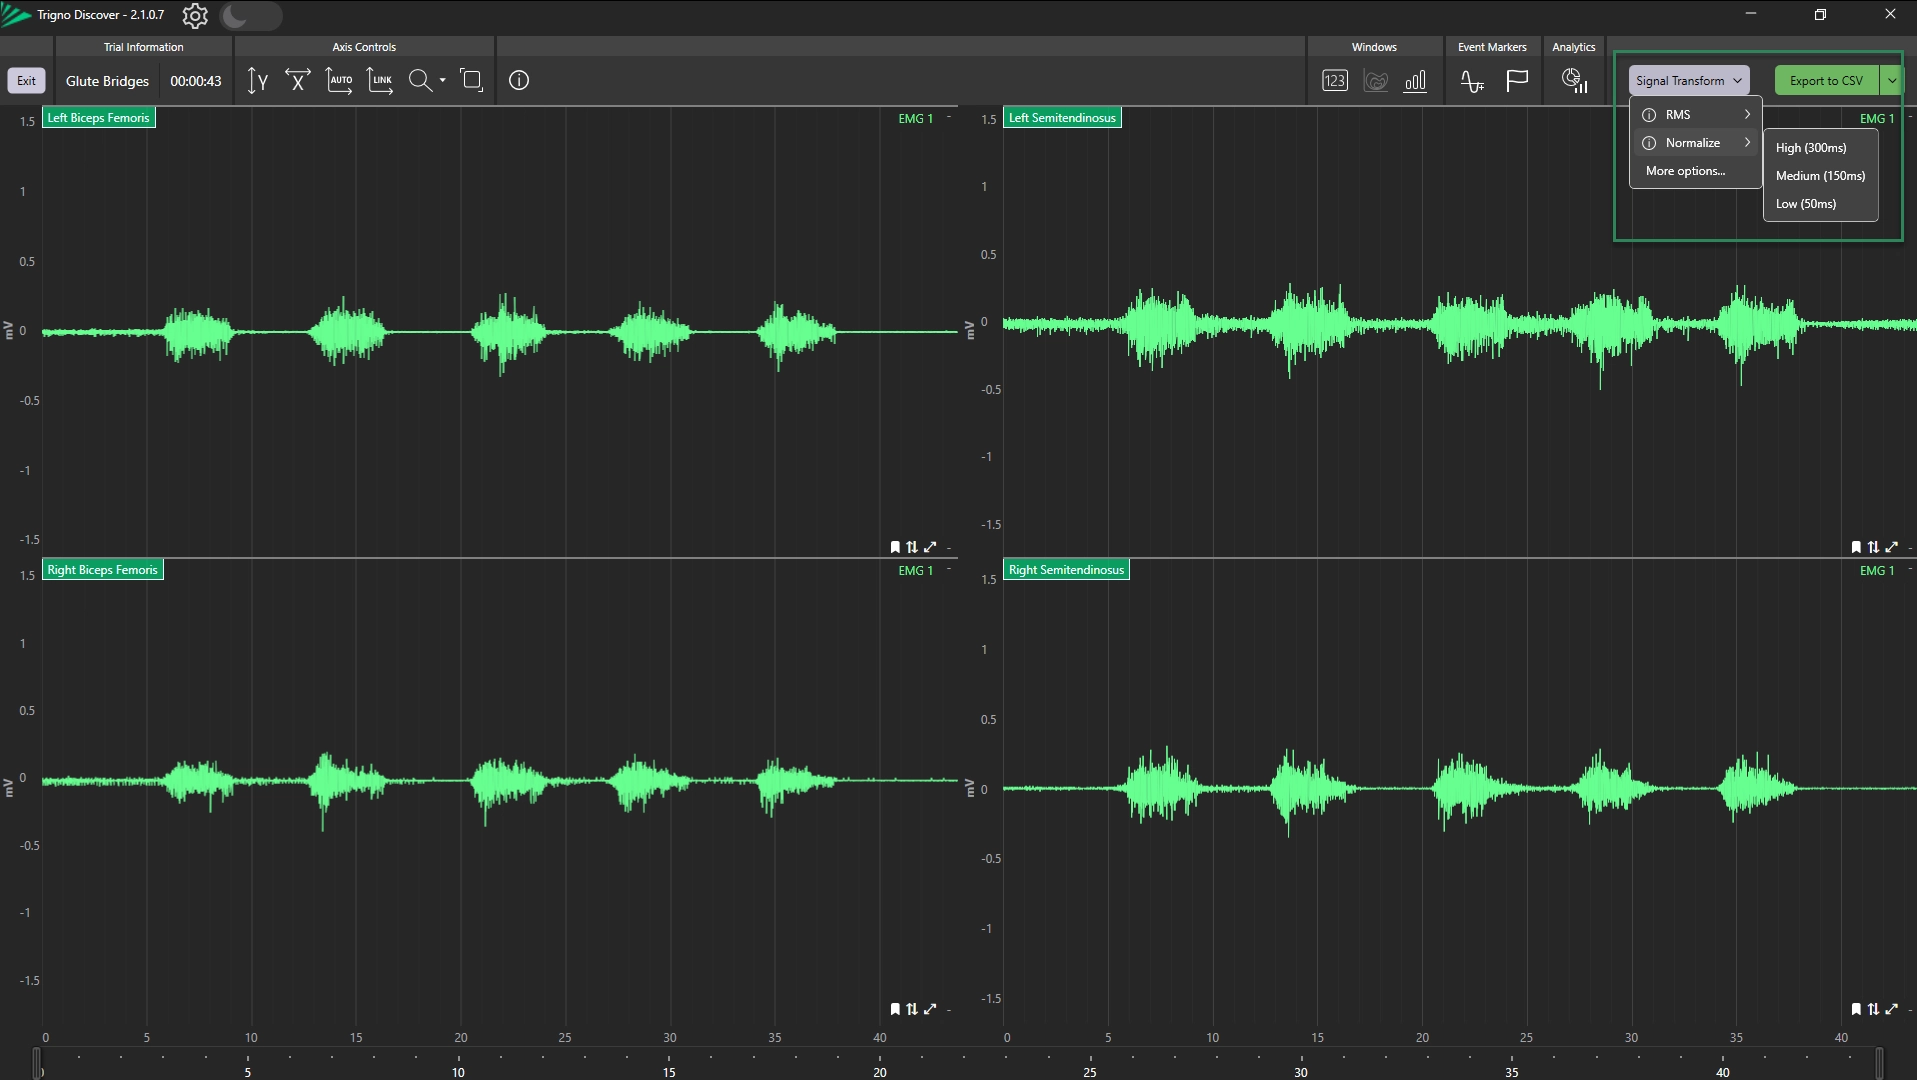
Choose from 300ms (high), 150ms (medium) or 50ms (low).
A new data channel will be generated with the transformed data.
Information
The window overlap is set to 80%. A longer window length results in more smoothing of the signal.
The window length determines how much data is included in the rolling RMS calculation:
300ms: Suitable for isometric tasks where the signal changes slowly
150ms: A flexible option that can be used for most tasks
50ms: Useful for highly dynamic activities (e.g., sprinting or contact drills), where a shorter window helps capture rapid peaks
Step 6: Post-Collection Event Marking Creation
This section provides an overview of creating and managing event markers in Trigno Discover, including threshold-based and manual markers, marker pairing, and adjusting or locking markers for accurate analysis. For detailed instructions, refer to Trigno Discover: Event Marking to learn more about how to perform the post-collection event marking.
Information
To access previously collected data for post-collection event marking, navigate to the Review tab in Trigno Discover, select the desired file from the list, and click Review to open it.
Access Event Marker Tools:
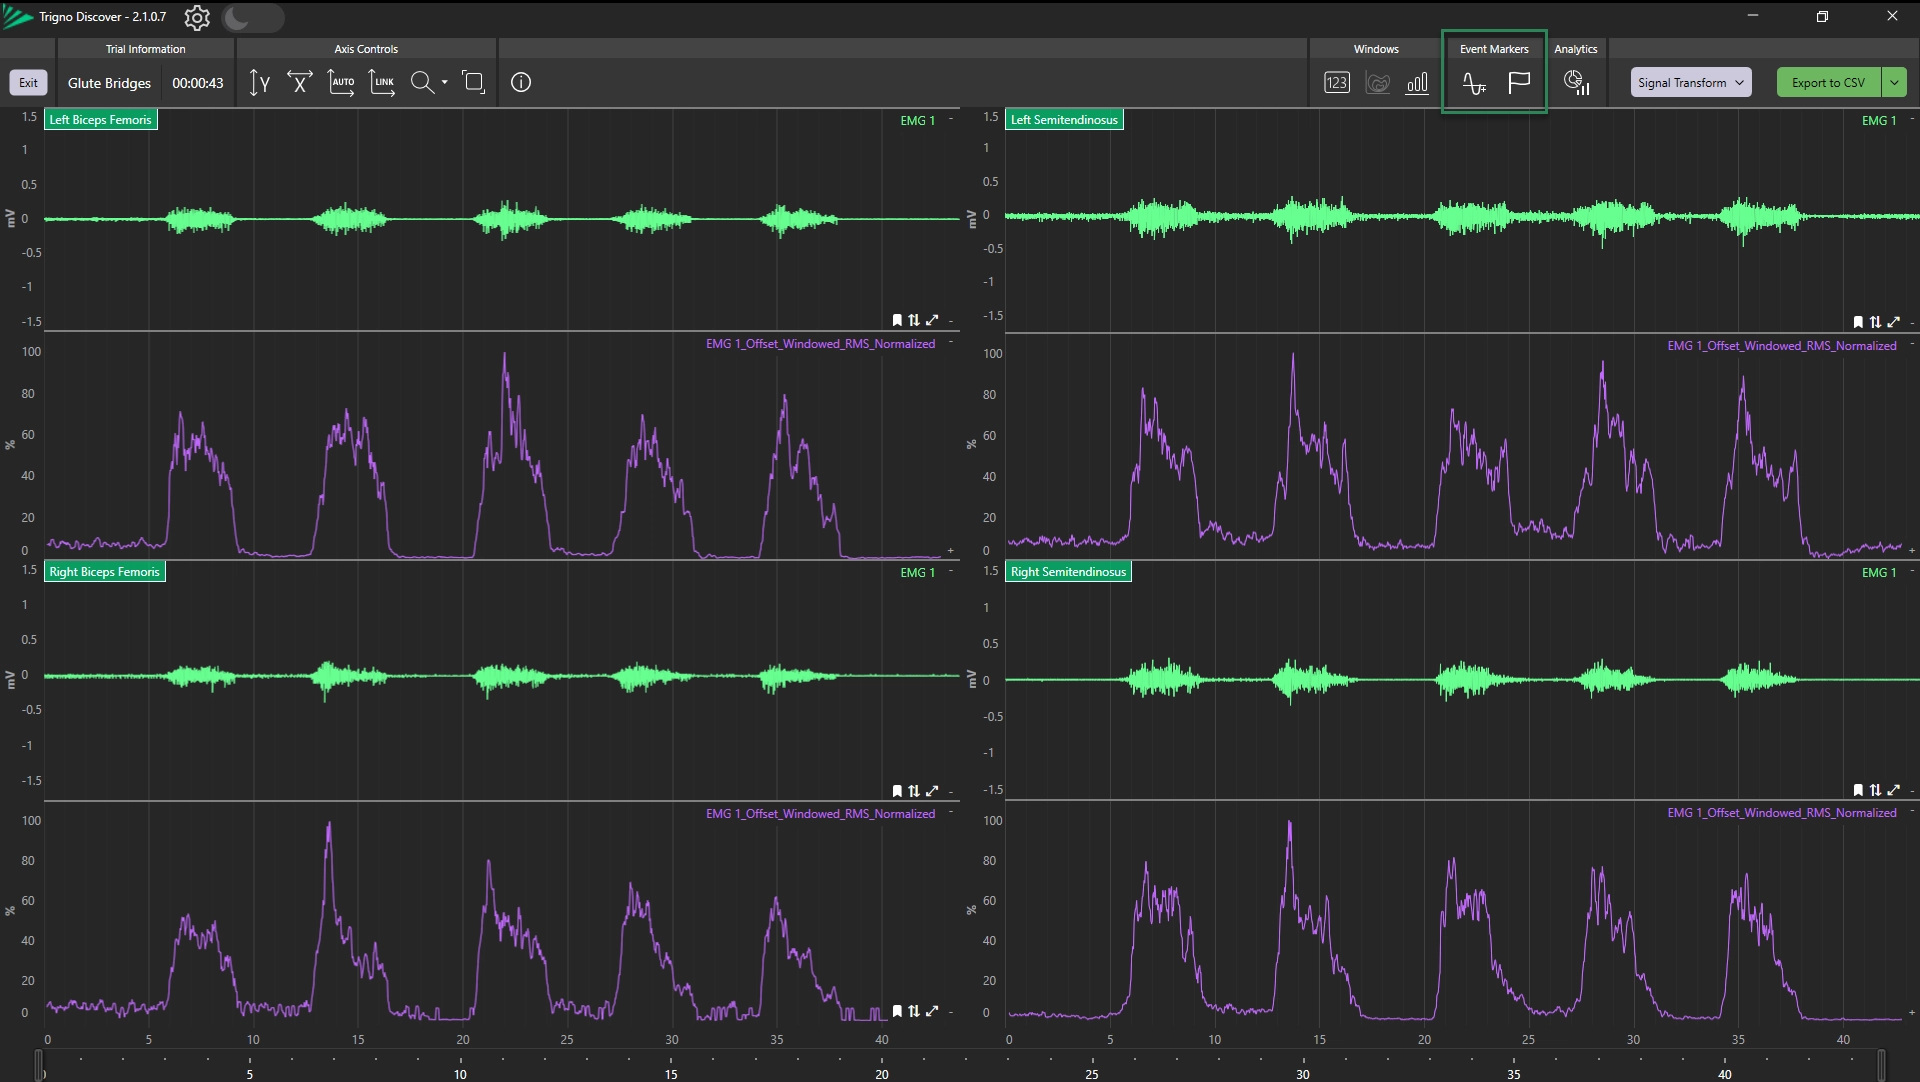
Navigate to the Event Marking section on the toolbar.
Choose one of the following methods:
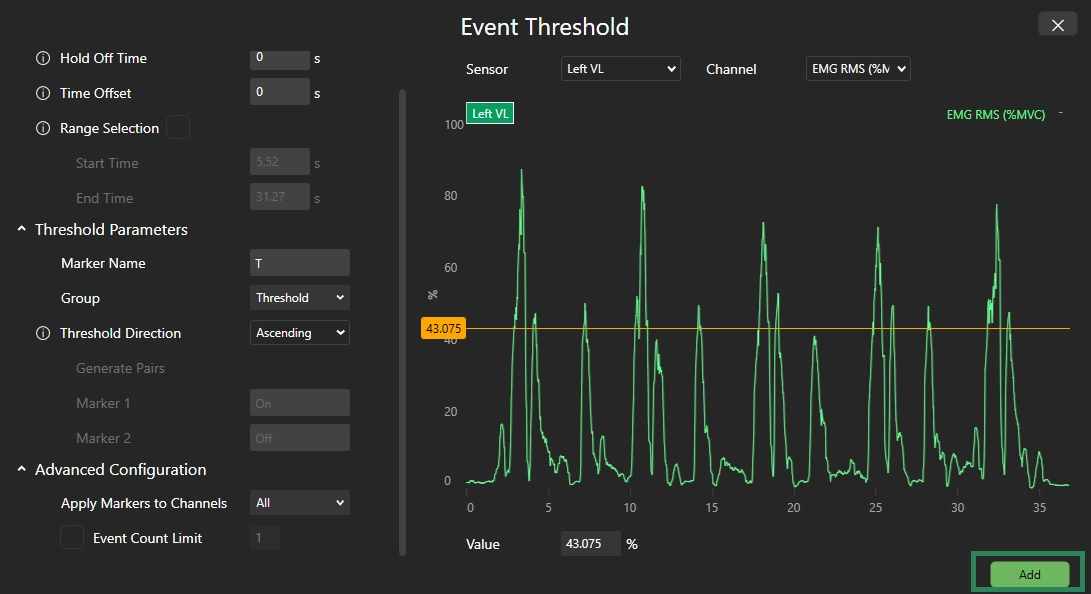
Create Event Markers and Event Markers Based on Threshold: Automatically generates markers when a signal crosses a set threshold, with customizable settings.
Create Event Marker and Marker Groups Manually: Place and manage markers manually at specific time points during data review.
Information
Place event markers before and after each burst to accurately detect the number of repetitions.
Event markers can be placed on any data channel.
For analysis that looks at the whole movement and the coordination of different muscle activation timings within the movement, using an IMU channel is optimal.
For analysis that looks purely at amplitude-based statistics of the EMG and not the timing or coordination between muscles, the EMG channel can be used for event marking.
Select a sensor and channel from the dropdown menus.
Set a threshold by dragging the Threshold Value Indicator or typing the value manually.
(Optional) Set the Hold-Off Time (seconds) to avoid multiple detections in quick succession.
(Optional) Define a Time Offset (seconds) to adjust the event placement by shifting it forward or backward in time relative to when the signal crosses the threshold.
(Optional) Enable Range Selection to limit event marking to a specific time window:
Drag start/end points on the X-axis, or
Enter values in the Start Time and End Time fields.
Configure Threshold Parameters:
Enter a Marker Name for the event.
Create a Marker Groups by typing a name in the search bar.
Choose the Threshold Direction to determine when events will be generated as the signal crosses the threshold:
Ascending: The signal crosses the threshold upwards.
Descending: The signal crosses the threshold downwards.
Both: The signal crosses the threshold in either direction.
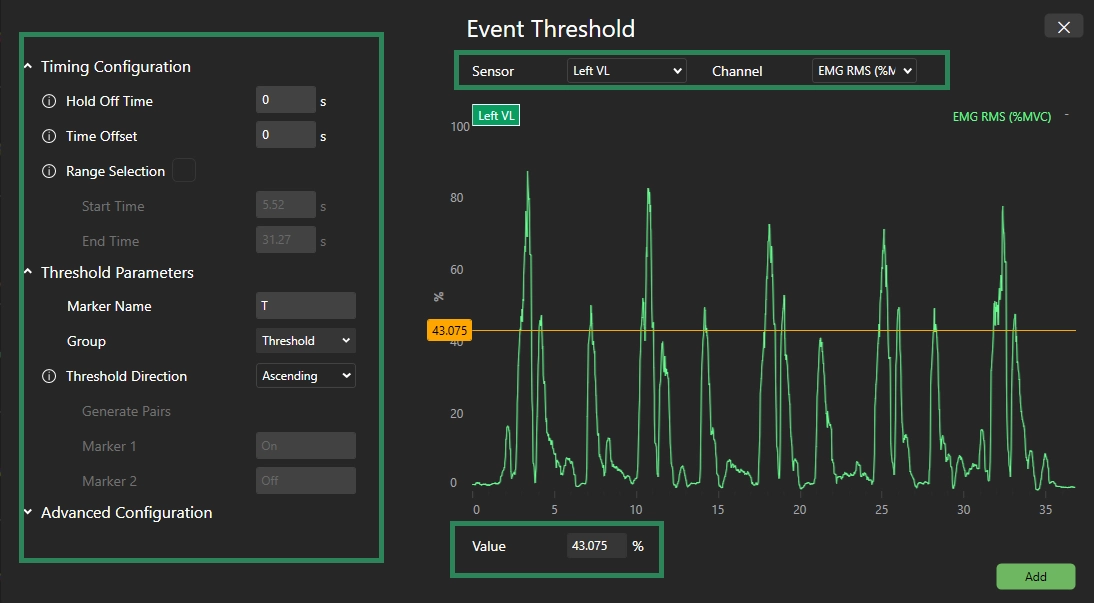
Click Generate Pairs to create paired markers (only works when slope is set to Both)
Information
Paired event markers can only be generated if Generate Pairs is enabled. Marker 1 and Marker 2 can be renamed as needed.
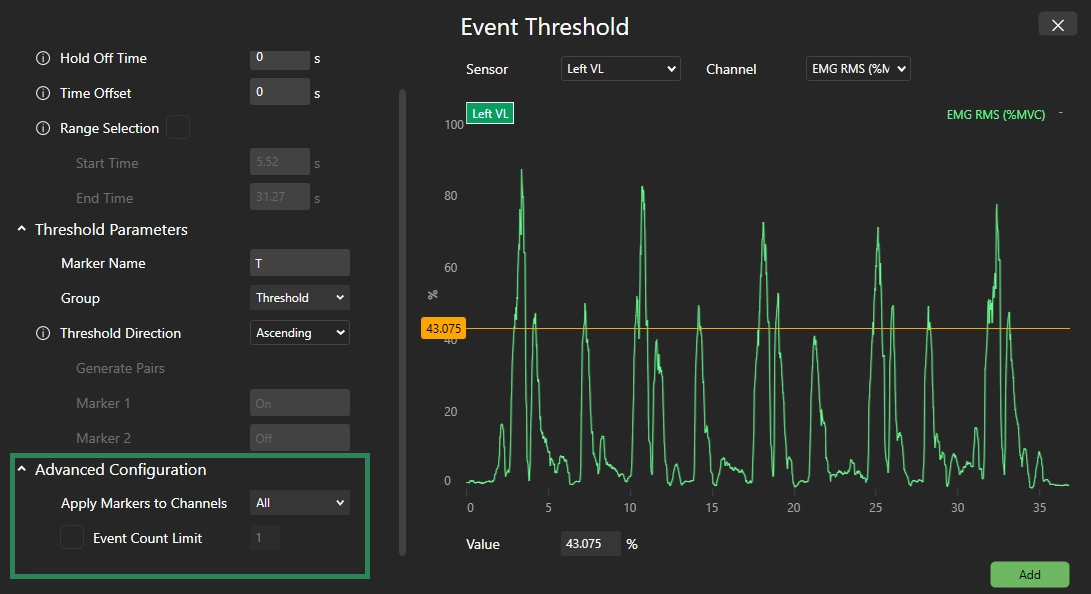
Use Advanced Configurations to limit total events and use Apply Markers to apply markers to specific channels.
Click Add to place the markers.
Drag markers along the X-axis to adjust their position as needed.
Open the Event Markers Pane
Click “+” to add Event Marker or add Event Marker Pair
Information
Press F5 for a single marker, F6 for a marker pair, or right-click the timeline and select the event marker or event marker pair options.
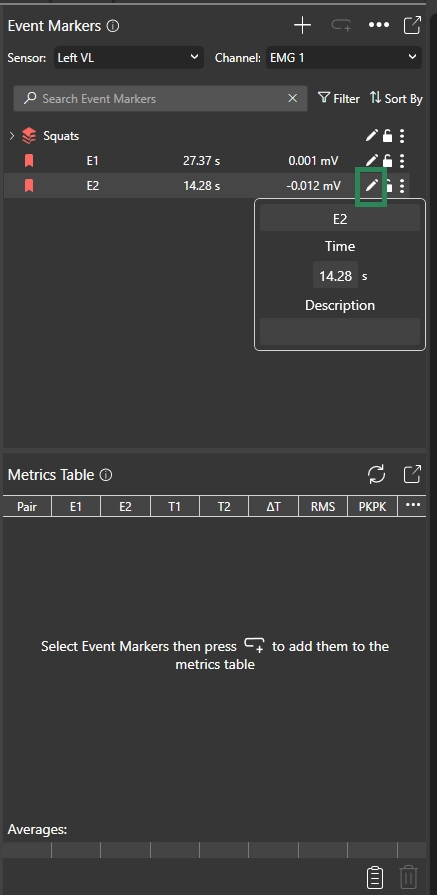
Lock markers with the lock icon to prevent accidental movement. Unlock to reposition.
Click the pen icon to rename markers, add descriptions, or move the event to a specific time.
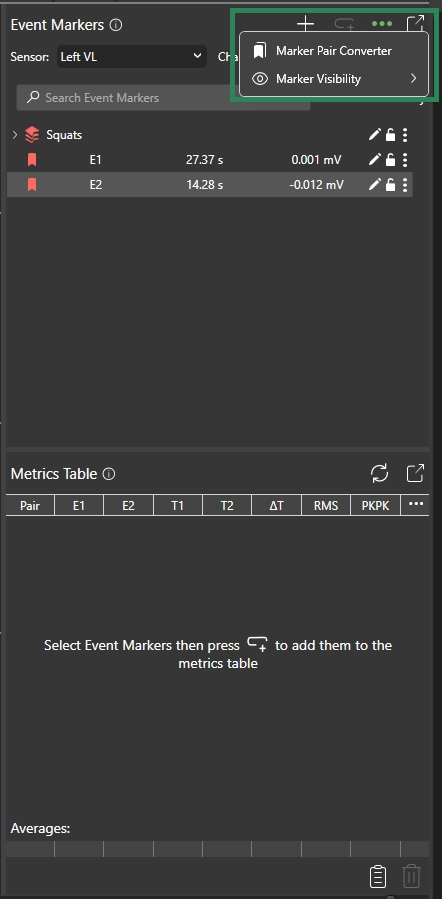
Click More Options (the ellipsis in the top-right) and select Marker Pair Converter to create an Event Marker Pair from existing event markers.
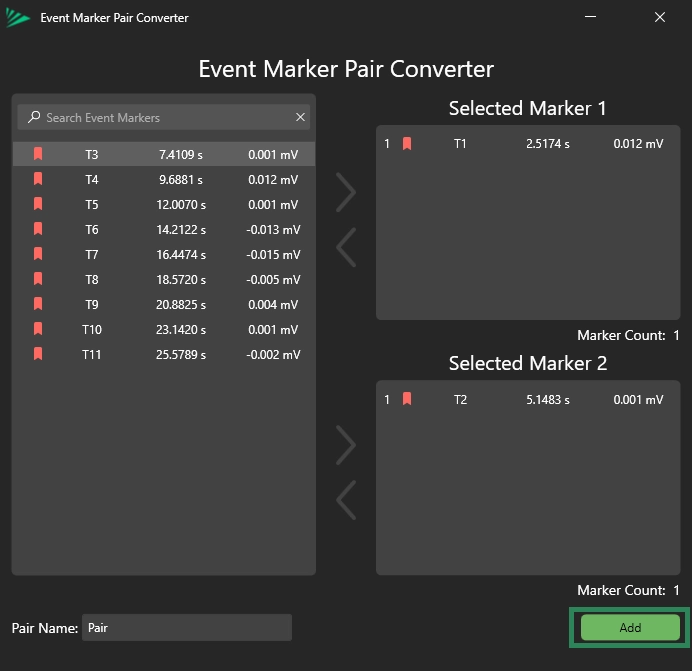
All available event markers will appear in the list on the left.
Select the event marker to assign to Selected Marker 1, then select a second event marker to assign to Selected Marker 2.
Rename the Pair Name if desired.
Click Add to create the event marker pair.
Information
Event Marker pairing can also be performed in bulk.
Creating Event Marker Group:
Click “+” or the F7 key to add an Event Marker Group.
To add an Event Marker or an Event Marker Pair to an Event Marker Group, click and drag the Event Marker into the created group, or right-click and select Move-To.
Click Add to confirm pairing.
Information
Markers are paired based on their stack order.
DOC-660-1-0


.png)
