Overview
This article covers the NeuroMap Explorer software, which allows you to visualize motor unit activity, offering powerful insights into neuromuscular control during complex movement. You will learn how to use NeuroMap Explorer to visualize your motor unit data and export your decomposed data for further processing.
System Requirements
Material/Tool | Description |
|---|---|
Software | NeuroMap1.0.0+, NeuroMap Explorer1.0.0+ |
Operating System | Windows 10+ |
Minimum PC Specifications |
|
Step-by-Step Instructions
Step 1: Data Management in NeuroMap Explorer
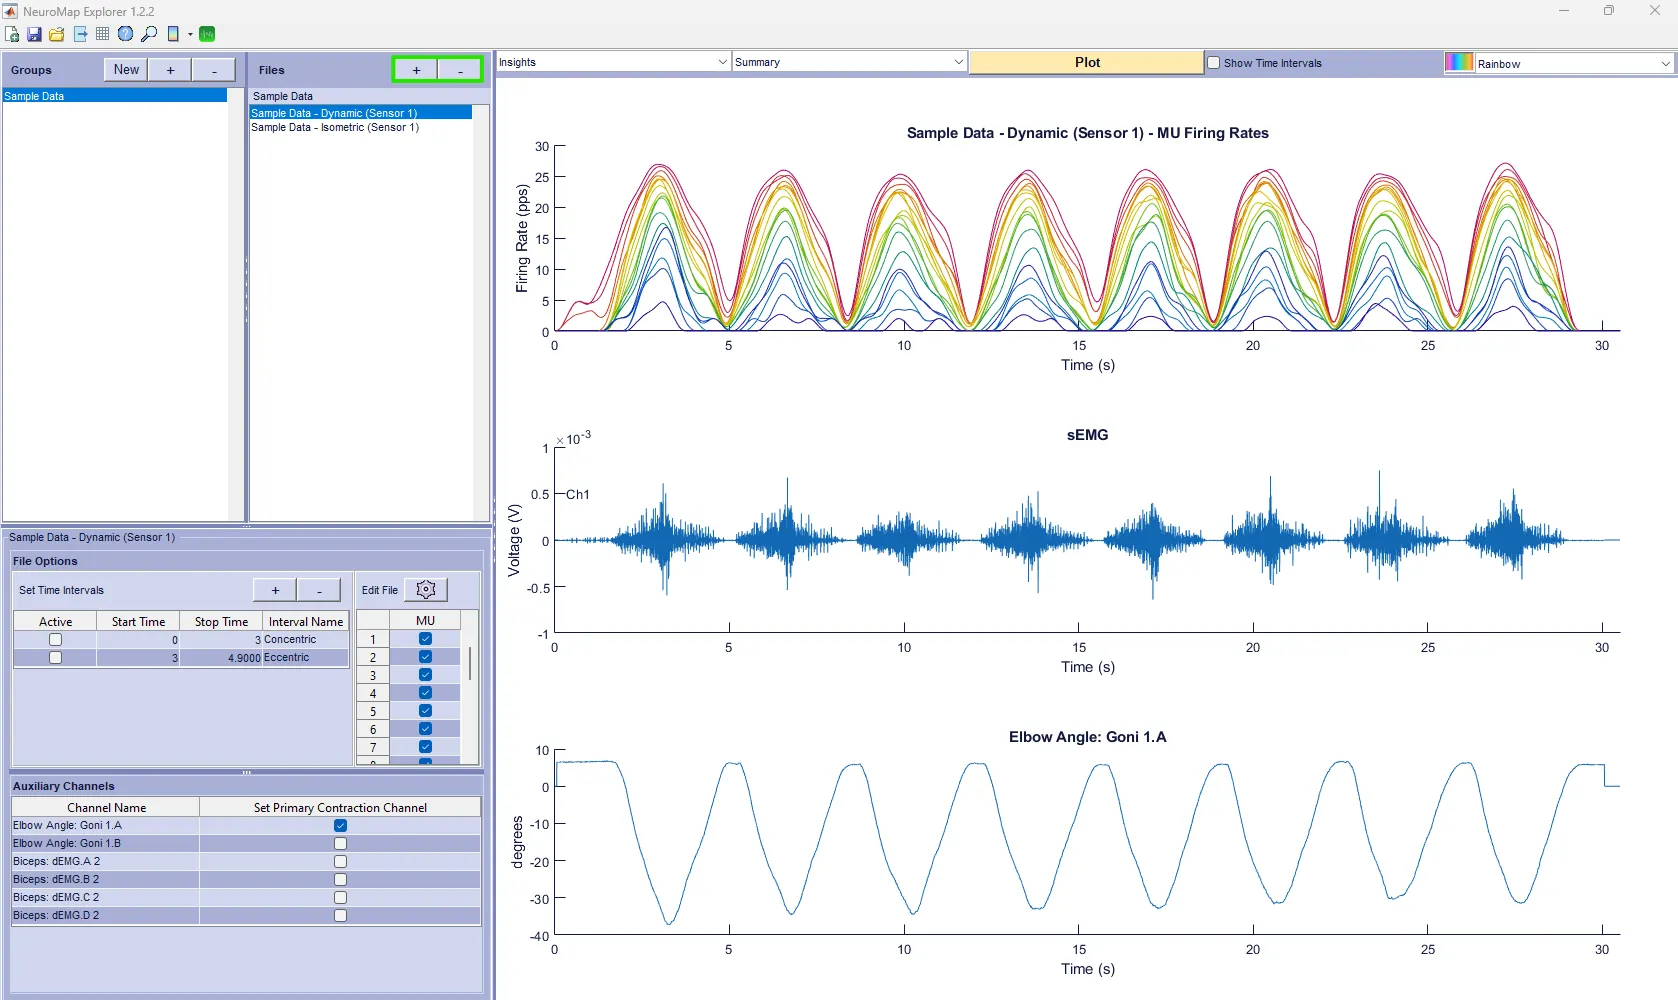
NeuroMap Explorer’s user interface features the “Groups” and “Files” sections, allowing users to easily organize their data.
Information
By default, there is a Sample Data group with sample data files from Dynamic and Isometric contractions. You can utilize this sample data to familiarize yourself with the NeuroMap Explorer features.
Managing Groups
To create a group, click the “New” button
Name your group and choose the save location for your group
You can add previously created groups to the workspace by clicking the + button in the Groups tab
You can remove groups from the workspace by selecting the group name then clicking the - button in the Groups tab
This does not delete the group, it just removes it from the workspace
Information
You will need to add in previously created groups each time you run NeuroMap Explorer.
Managing Files
To add a file, select the group you want to add the file to, then click the + button in the Files tab
Select the .DHPF file you want to import
Files will be saved to their group so they can easily be added each time NeuroMap is opened
To remove a file from the group, click the file you want to remove, then click the - button in the Files tab
This does not delete the file, it just removes it from the group
Important
Only .DHPF files can be processed via NeuroMap Explorer. (See Installing NeuroMap and Decomposing Data)
Step 2: Plotting Data in NeuroMap Explorer
Selecting plot type through the toggle options
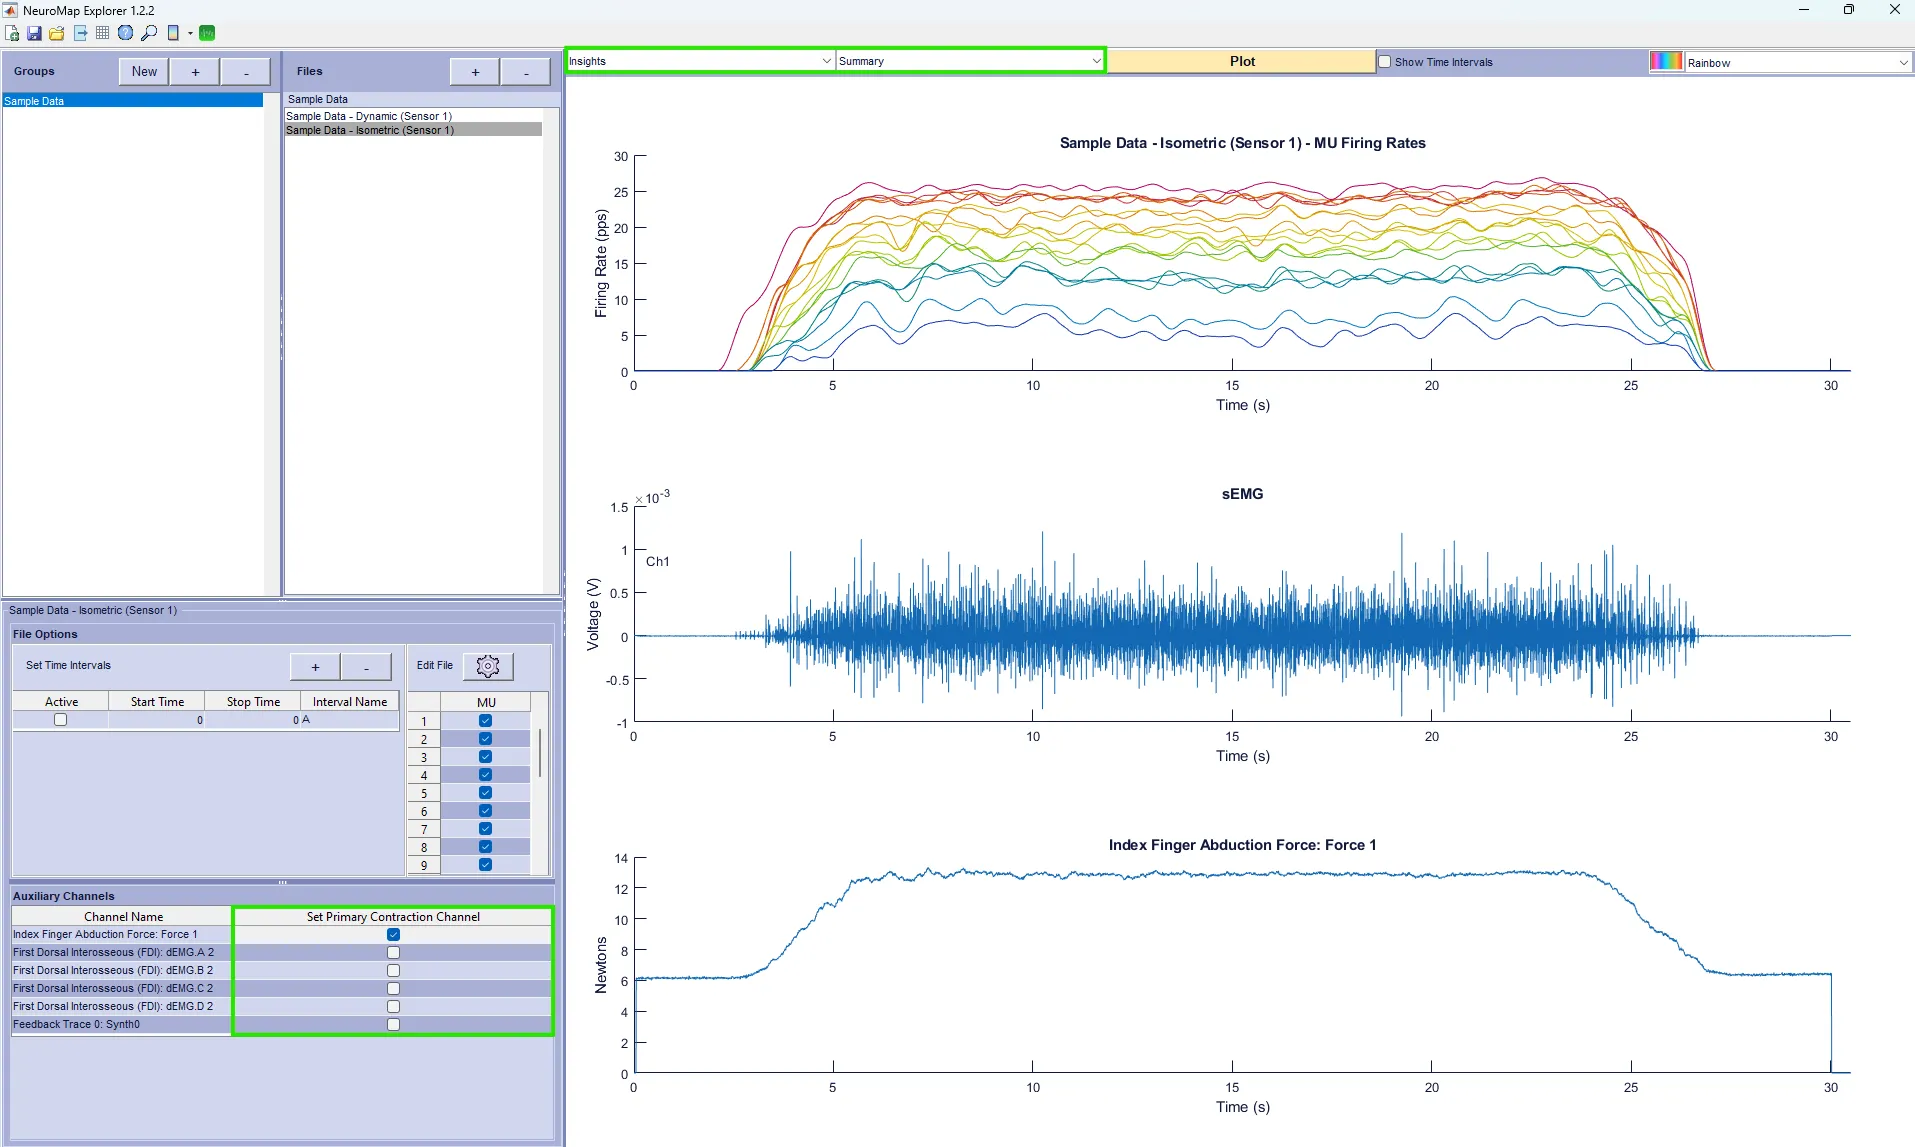
Insights
Look at a summary of the MU Firing Rates, sEMG data, and a user-selected primary contraction channel
Display a primary contraction channel
Only one channel can be selected as the primary contraction channel at a time
Information
The plot button must be selected each time you want to view or visualize a different graph or statistic.
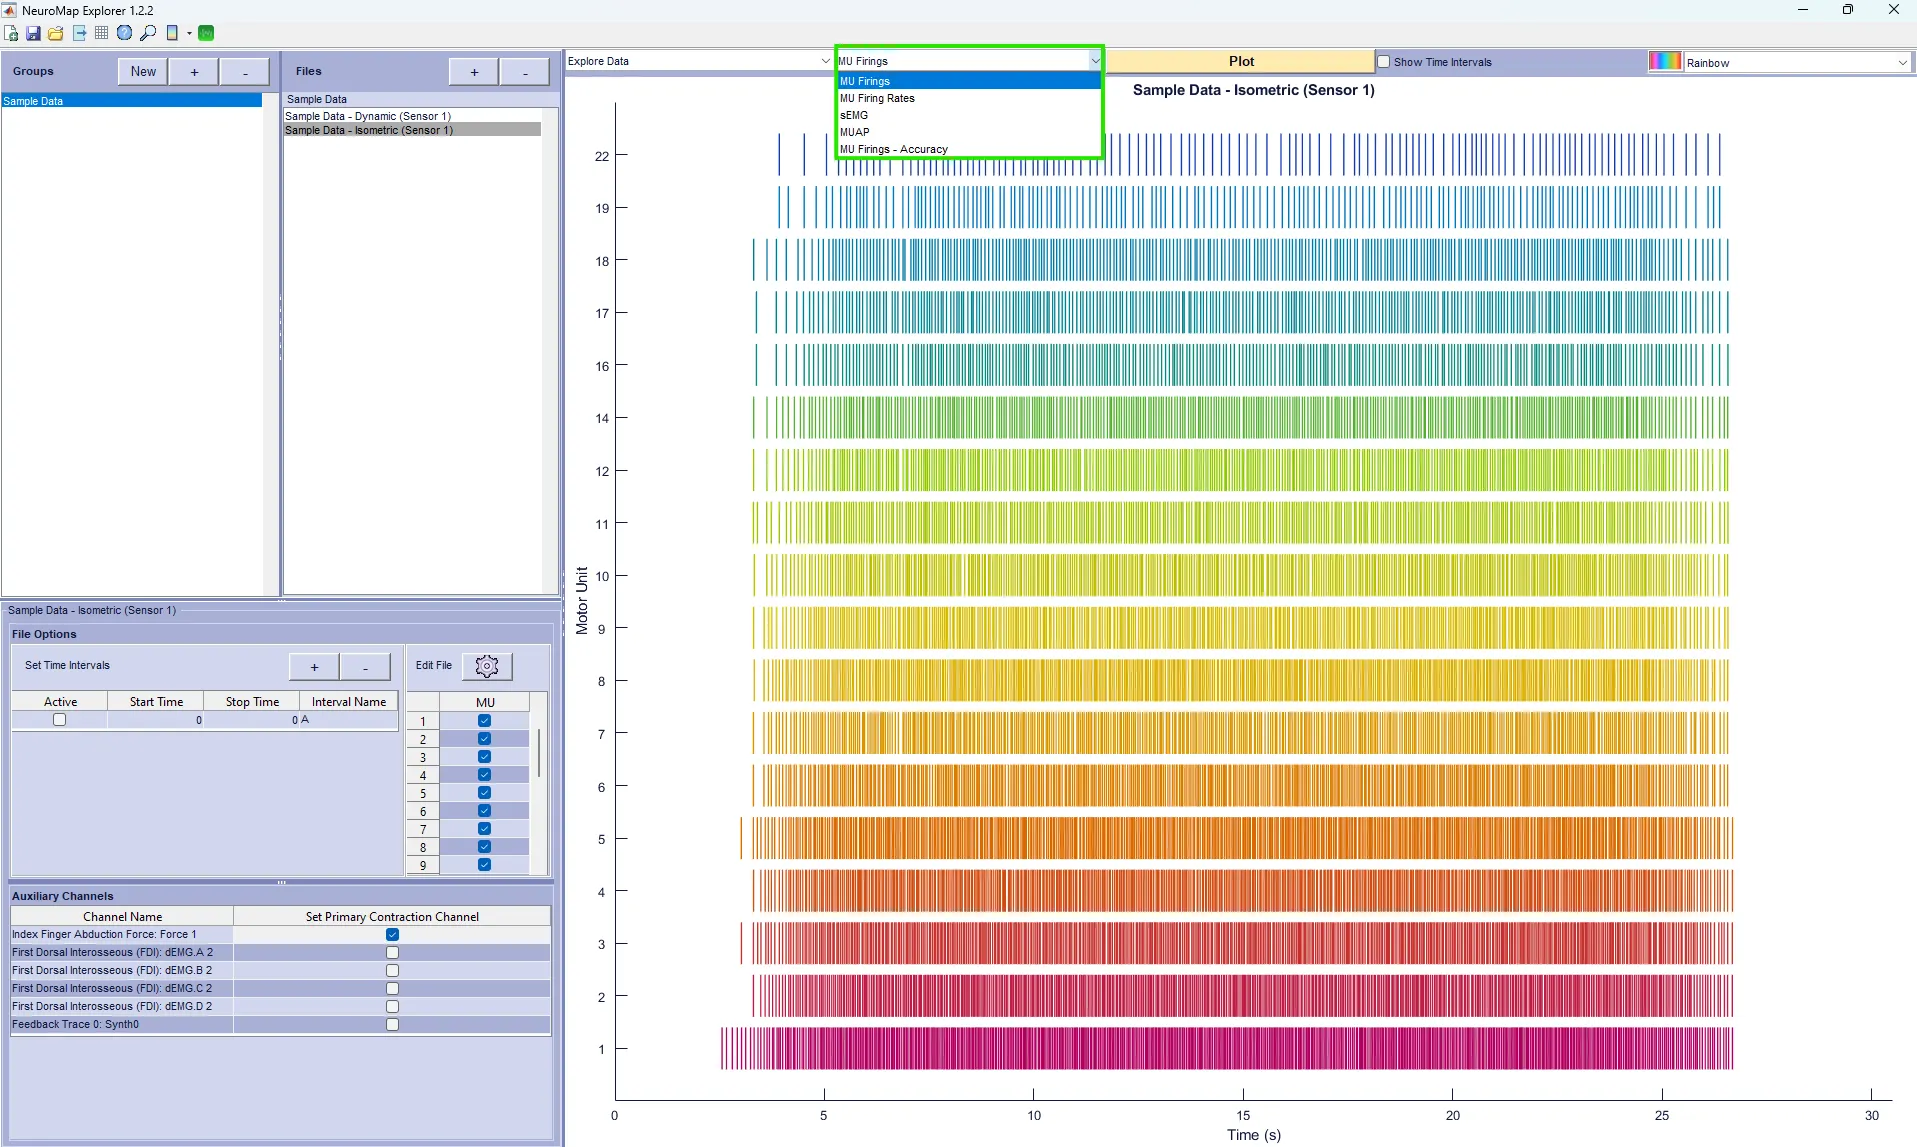
Explore Data
Choose between a plot of the MU Firings, MU Firing Rates, sEMG, MUAP, and MU Firings - Accuracy
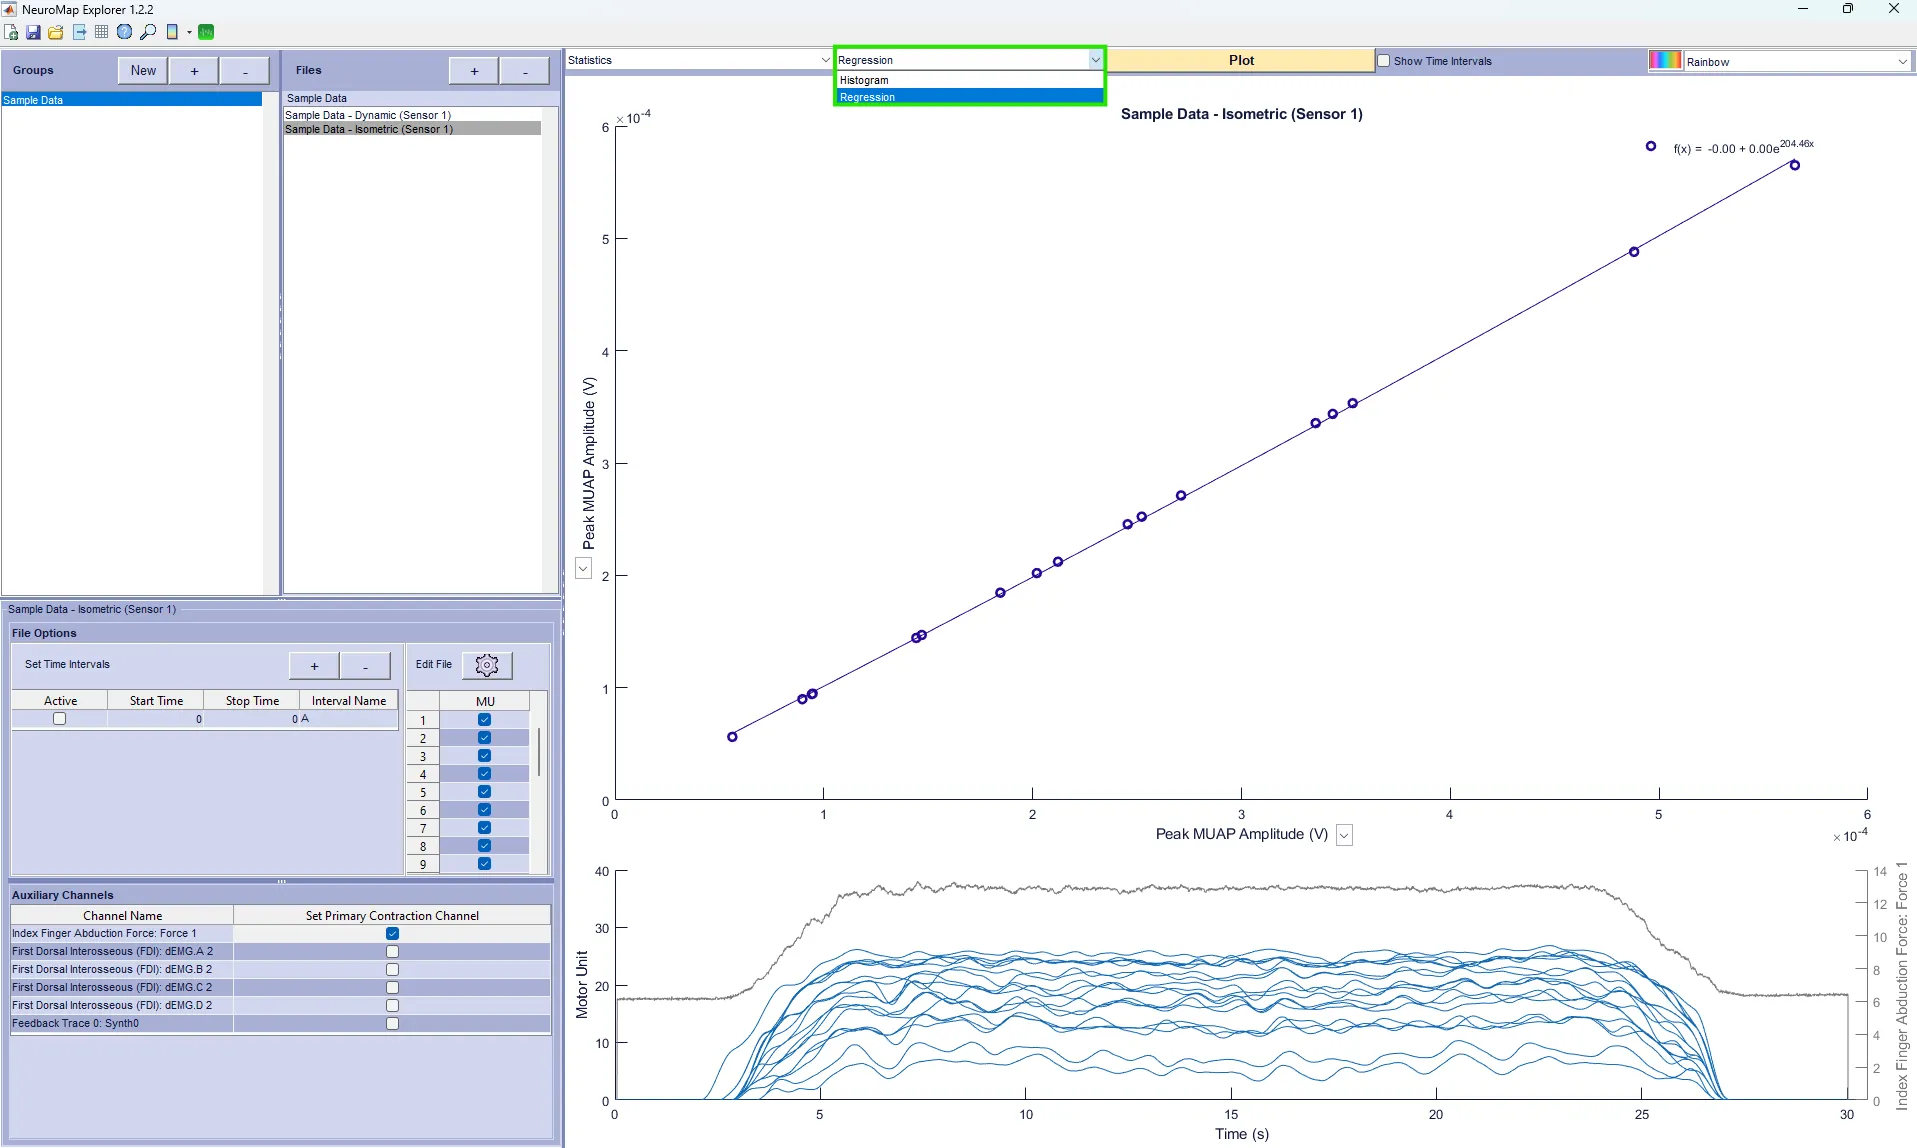
Statistics
Choose between a histogram or regression
The X and/or Y axes can be toggled to change the plot
Setting a primary contraction channel is required for recruitment and de-recruitment graphs
Information
Recruitment and De-recruitment graphs are designed to work with force channels, but other data can be used if desired.
Choose which motor units are included in the plot by selecting the toggle icon in the Edit File window.
Define an accuracy threshold - only motor units with an accuracy that’s higher than the defined value will be plotted
Adjust the Hann Window
Manually select/deselect motor units that you would like to add/remove to your plot
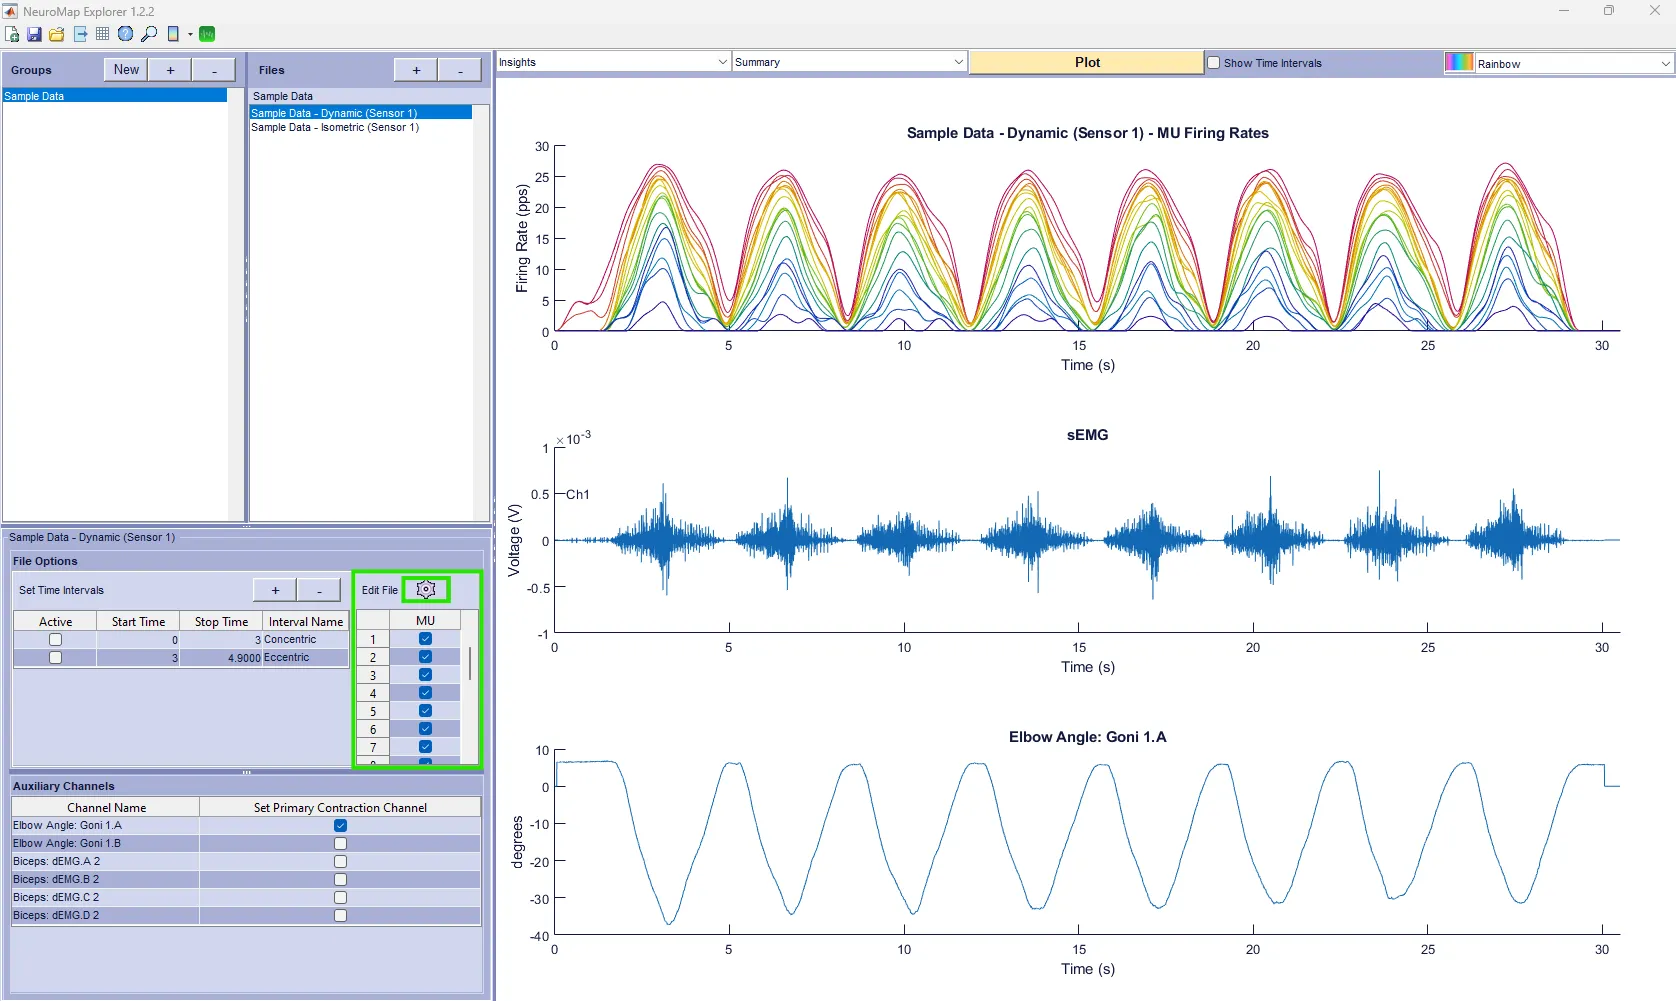
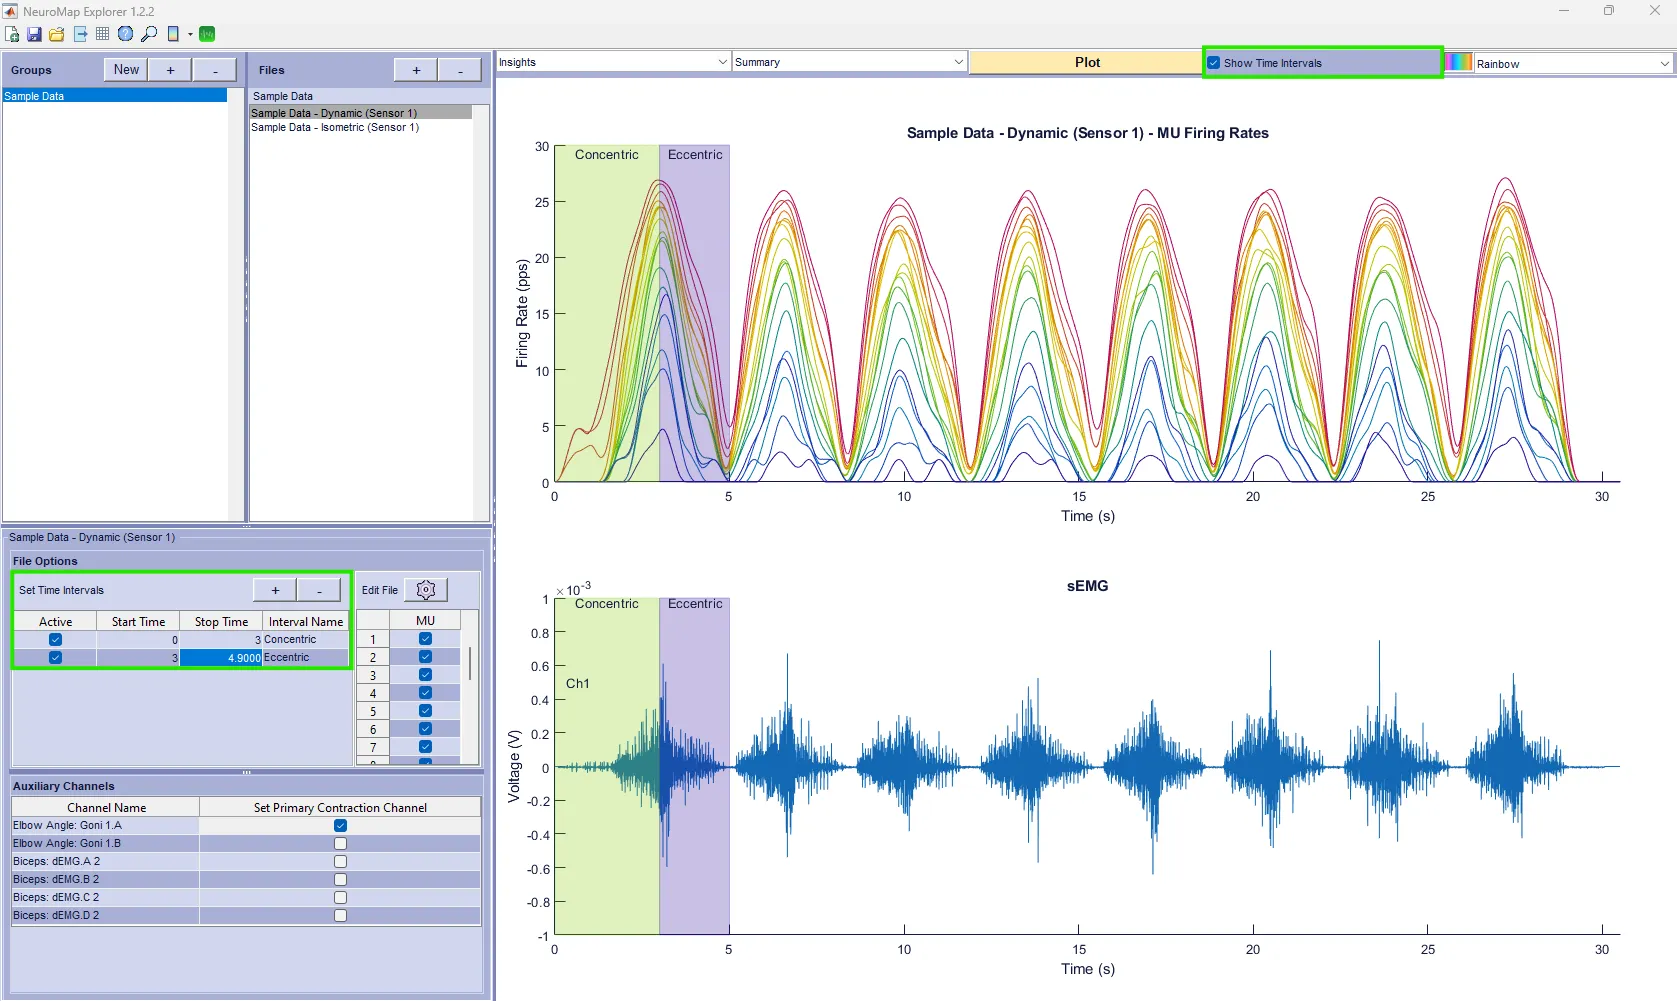
Add time intervals
Click the + button to add a new interval
Define the start time and the stop time
Choose the interval name
Ensure the Active box is checked next to each of the intervals you want to display
Ensure the Show Time Intervals box is checked
Step 3: Exporting Data
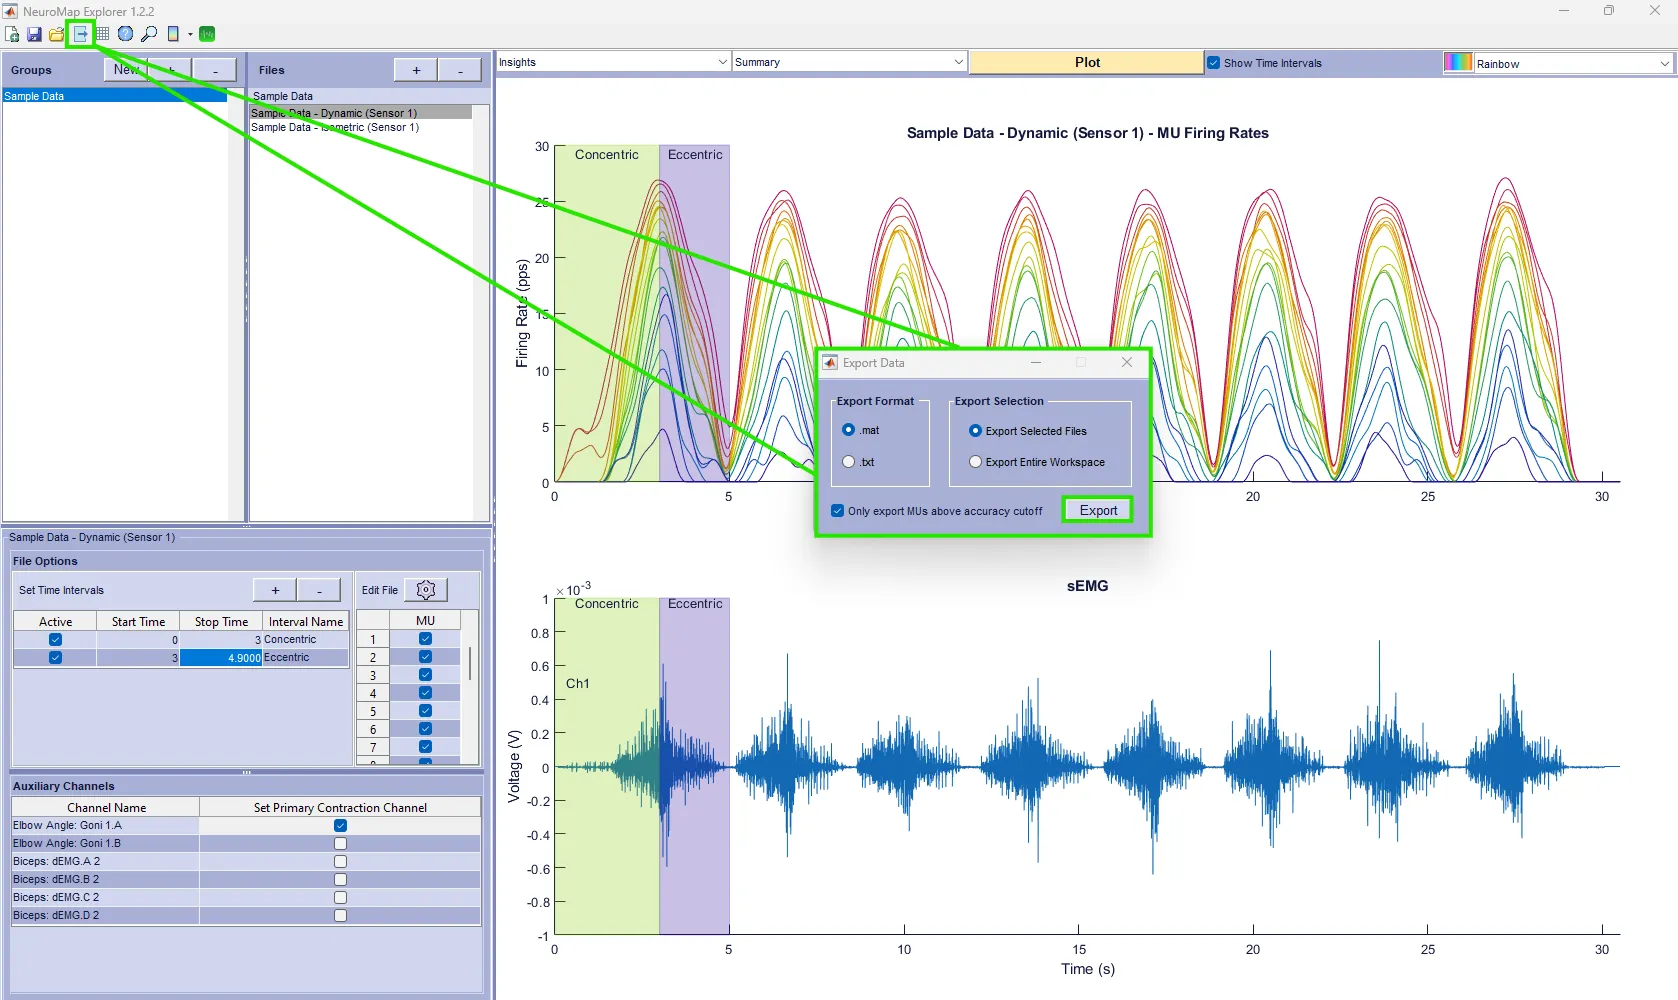
Click the export data button and choose your export format
Choose between exporting the selected files or the entire workspace
Choose if you want to export all motor units or only the motor units above the accuracy cutoff value selected in step 2 (2.a)
Click the Export button, then select the save location
DOC-663-1-0