Important:- EMGworks Compatibility Notice
EMGworks Acquisition and Analysis 4.8.0 was released in December 2021 and is now ‘End of Life’. Due to constantly evolving operating systems, hardware, and software dependencies, EMGworks may be incompatible with current releases of Windows operating systems and PC hardware. Please contact Delsys Support if you have questions and for best practices when installing EMGworks.
Overview
This guide will walk through EMGworks Analysis, which is a legacy software designed to plot EMG data, run calculation scripts to filter/rectify data, and to perform basic analysis. This guide will cover installation, licensing, initial setup, adding data, plotting, calculation scripts, basic analysis, and data exporting.
To learn how to collect EMG data that you can use in EMGworks Analysis, refer to our Trigno Discover Getting Started series.
Important
Only .HPF Files can be analyzed in EMGworks Analysis. Data collected in Trigno Discover must be exported as a .HPF file to be analyzed in EMGworks Analysis.
EMGworks Analysis Getting Started Video Tutorial
Step-by-Step Instructions
Step 1: Installation
Contact Delsys Support for the EMGworks installer. This installer contains:
EMGworks Acquisition
EMGworks Analysis
Trigno Control Utility
The Delsys Software Update Tool
The Delsys File Utility
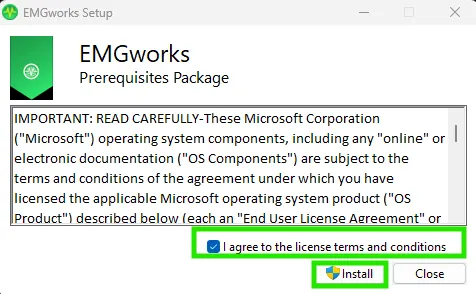
Run the installer and follow the on-screen prompts.
Step 2: Licensing
Information
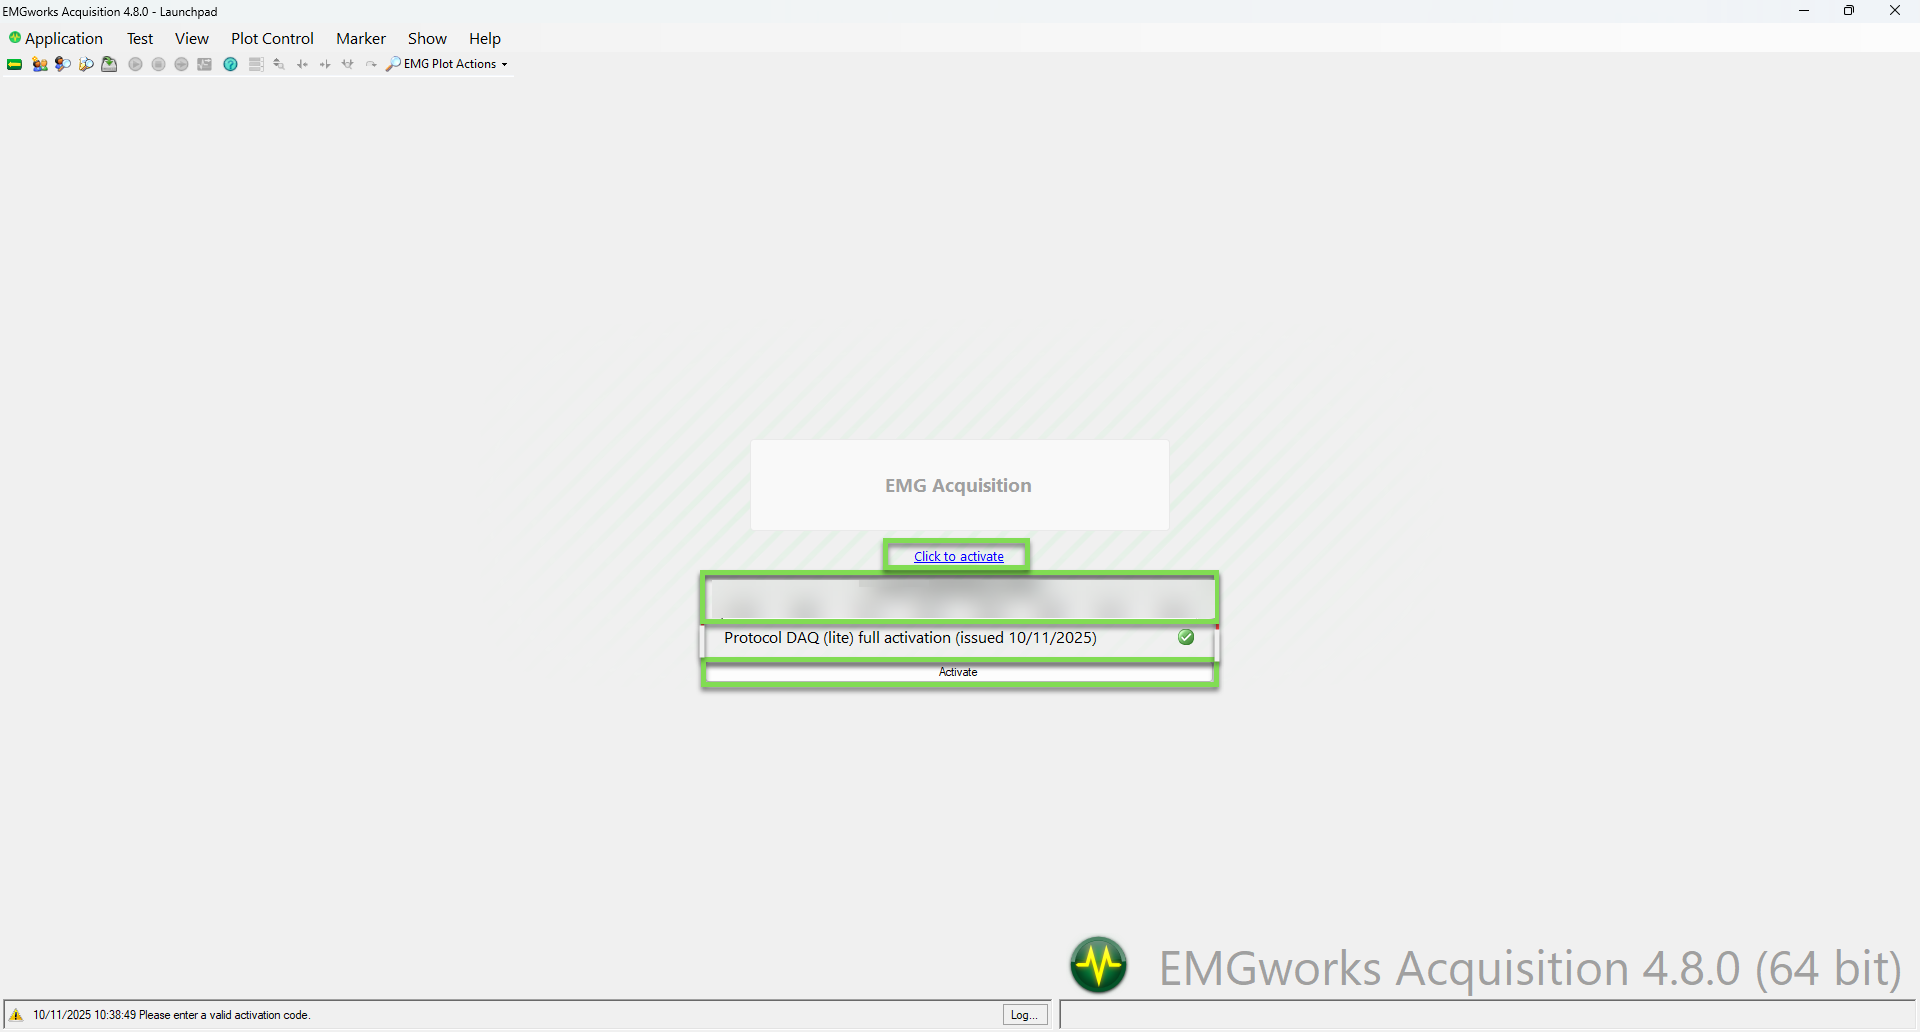
To use EMGworks Analysis you will need to download and activate EMGworks Acquisition.
Launch EMGworks Acquisition
Choose the “Click to activate” button
Enter your EMGworks License key, then click “Activate”
If you don’t have an EMGworks License Key, reach out to Delsys Support to receive an activation code.
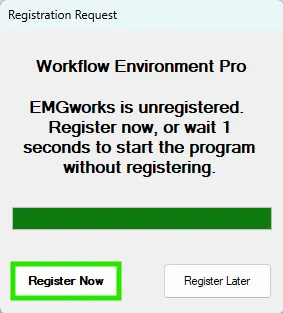
A Registration Request prompt will appear
Click Register Now
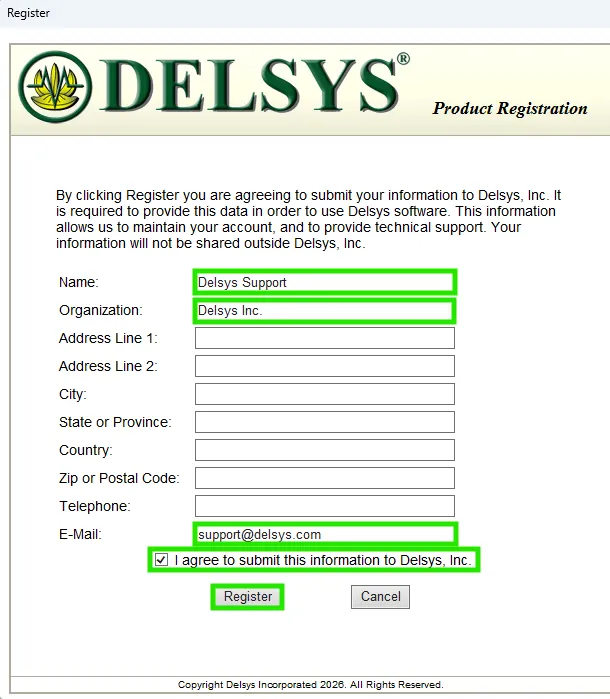
Submit your information to complete the registration
Fill in the Name, Organization, and E-Mail sections at a minimum.
Click Register.
Once registration is complete, close out of EMGworks Acquisition.
You will not need to use EMGworks Acquisition moving forward.
Important
EMGworks Acquisition & Analysis are one software. Users cannot uninstall EMGworks Acquisition without removing EMGworks Analysis as well.
Step 3: Initial Setup
Launch EMGworks Analysis
A prompt will appear to create or open an existing workspace.
Workspaces contain the files that are being analyzed, calculations that have been done, and plots that have been made.
Choose “Create new workspace” and click OK.
Once you have a workspace created, you will be able to choose the option to “Open existing workspace” in the future
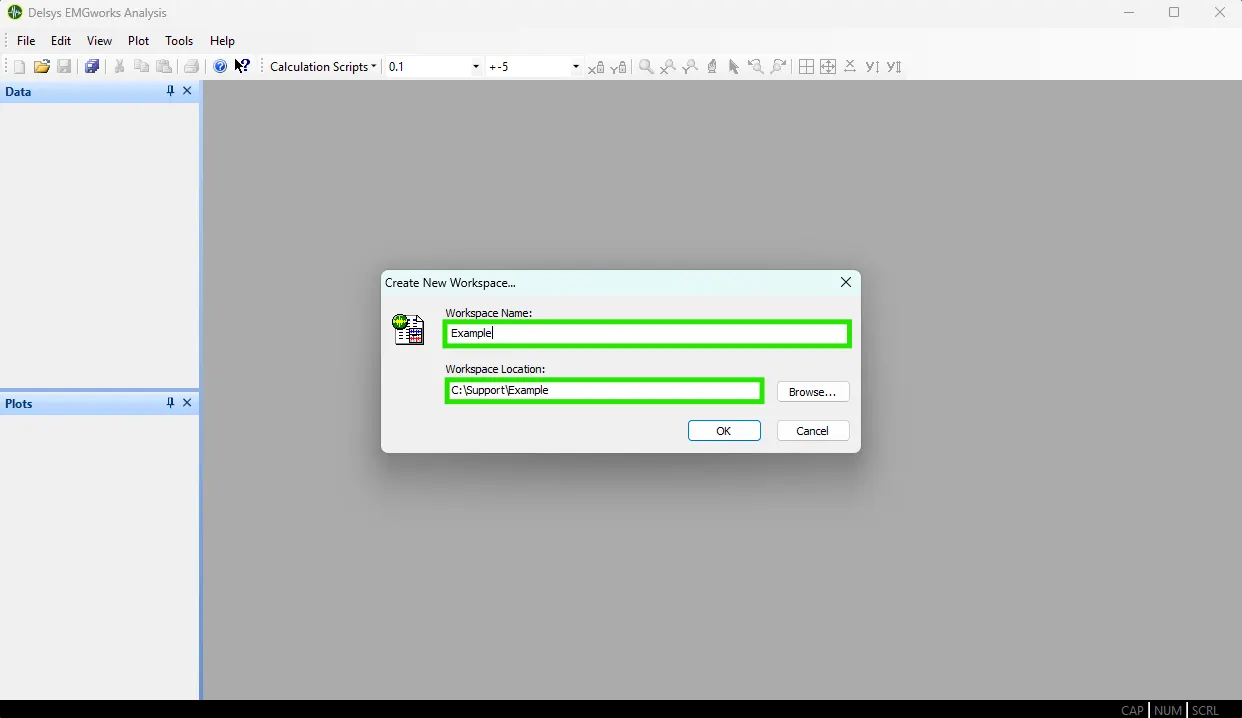
Choose the workspace save location and the workspace name, then click OK.
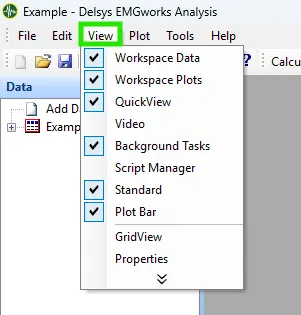
EMGworks Analysis has a customizable UI that allows users to select which view panels appear on screen.
Select the View tab to toggle different view panels.
Refer to the screenshot below to see which view panels are enabled for this tutorial.
View panels can be dragged and reorganized into the position of your liking.
Step 4: Adding Data
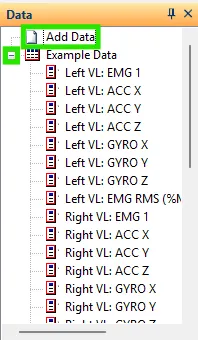
In the Data panel, click the Add Data button.
Locate the data file(s) you would like to add.
Only .HPF Files can be analyzed in EMGworks Analysis
Click Open to add them to EMGworks Analysis.
Raw data files will appear in a logo with a red border.
Click the + button to expand a file and show its contents, including data from different sensors and channels.
Information
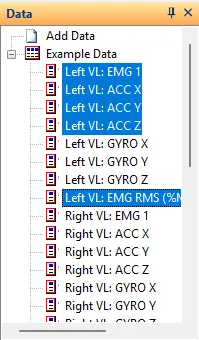
Select multiple channels by holding Ctrl on the keyboard and clicking each channel. Alternatively, hold Shift and left-click to select a range of channels. This will be useful for plotting multiple channels or running calculations on multiple channels at once.
Step 5: Plotting Data
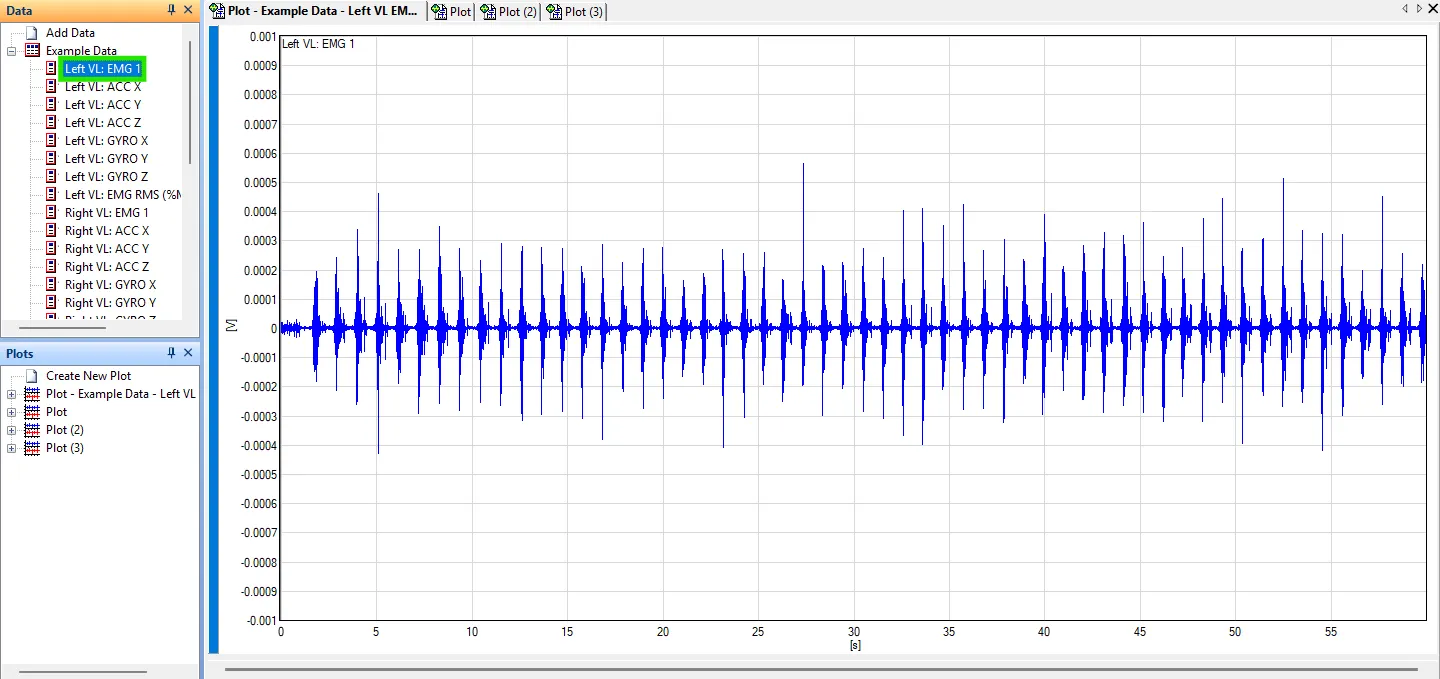
Option 1: Quick plotting a single channel
Double left-click a data channel to plot it.
Option 2: Quick plotting multiple channels
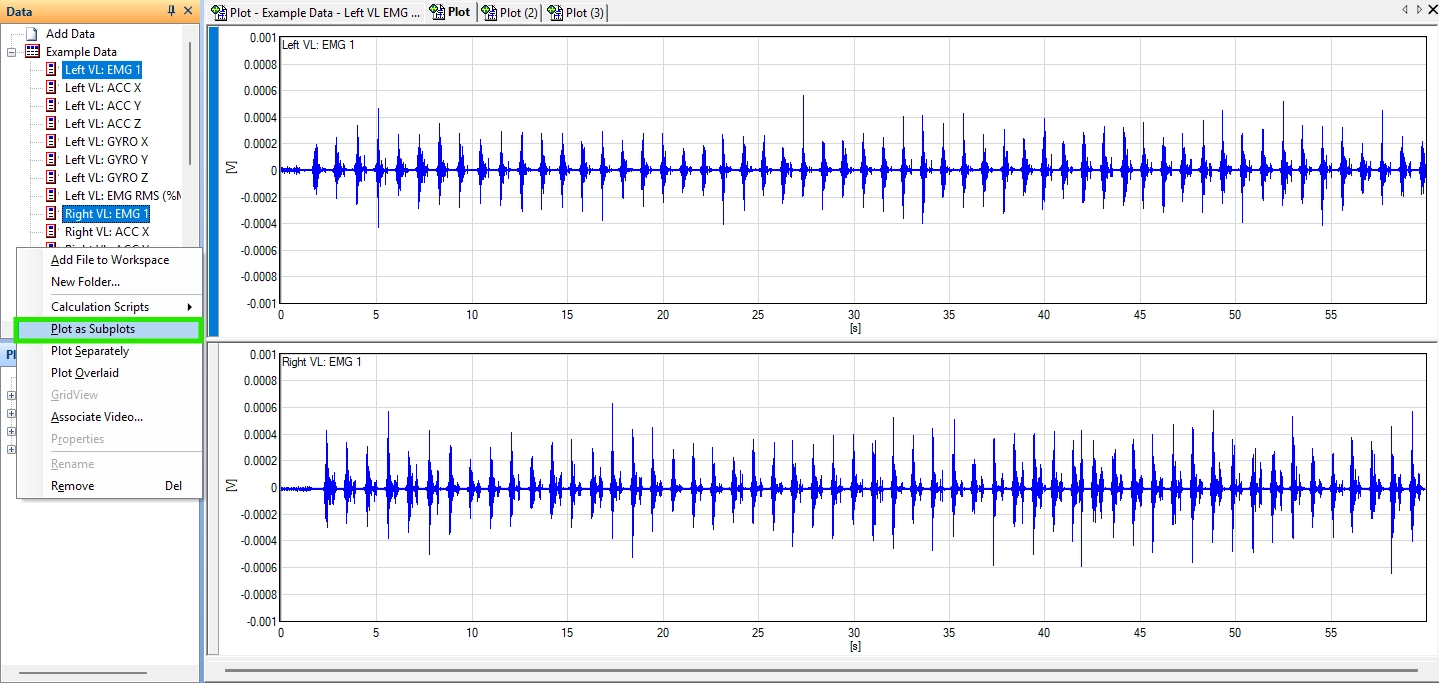
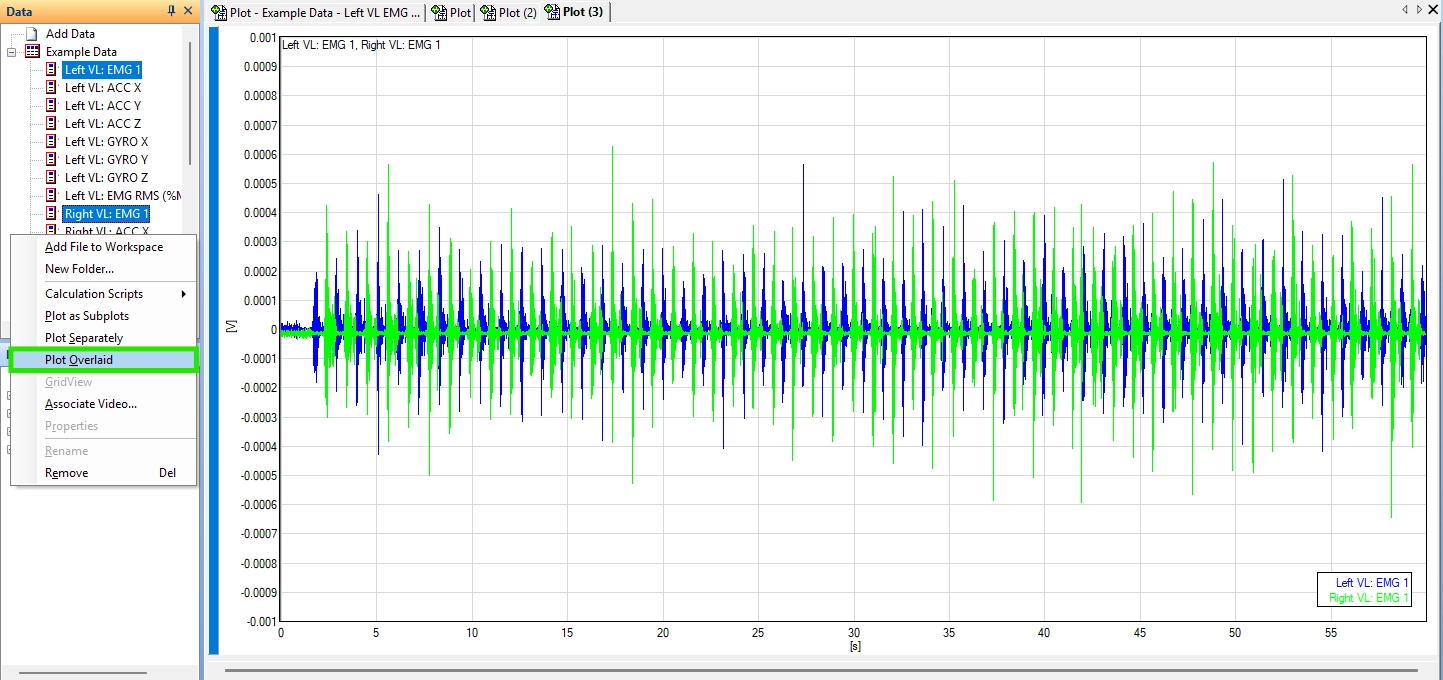
Select multiple channels of data, then right-click anywhere in the data panel.
Choose “Plot as Subplots” to plot multiple channels of data on their own graph with their own axes.
Choose “Plot Overlaid” to plot multiple channels of data on the same graph with the same axes.
Option 3: Plot Wizard
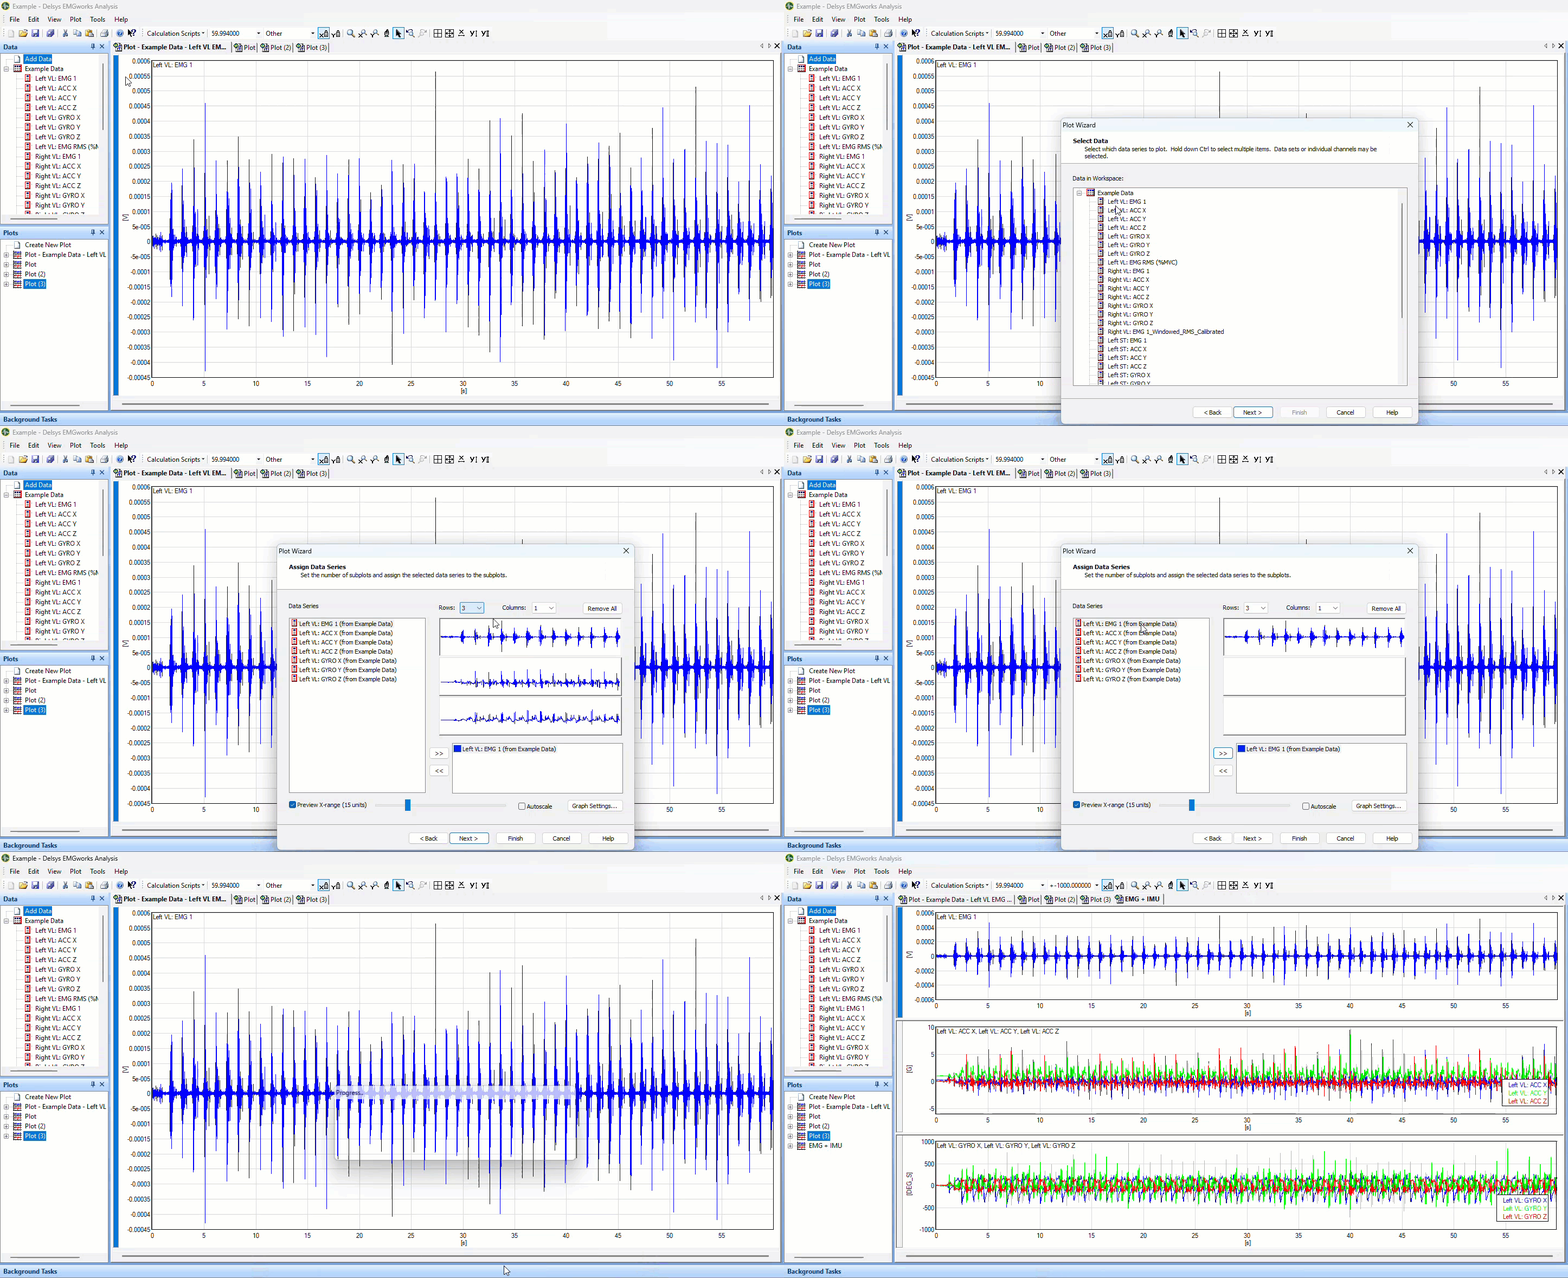
Click Plot > Create Plot… to open the Plot Wizard
Rename your plot, then click Next
Control + click the Data Channels that you want to add to the plot, then click Next
Choose the Remove All button to clear the plot contents.
Choose the number of rows and columns you want in your plot.
Click into each mini plot window and use the arrows to add/remove channels.
Multiple channels can be added to the same mini plot window.
Once all your mini plot windows have data, click Finish to create the plot.
Deselect the Y lock button, then choose the X autoscale and Y autoscale all buttons to best visualize the data.
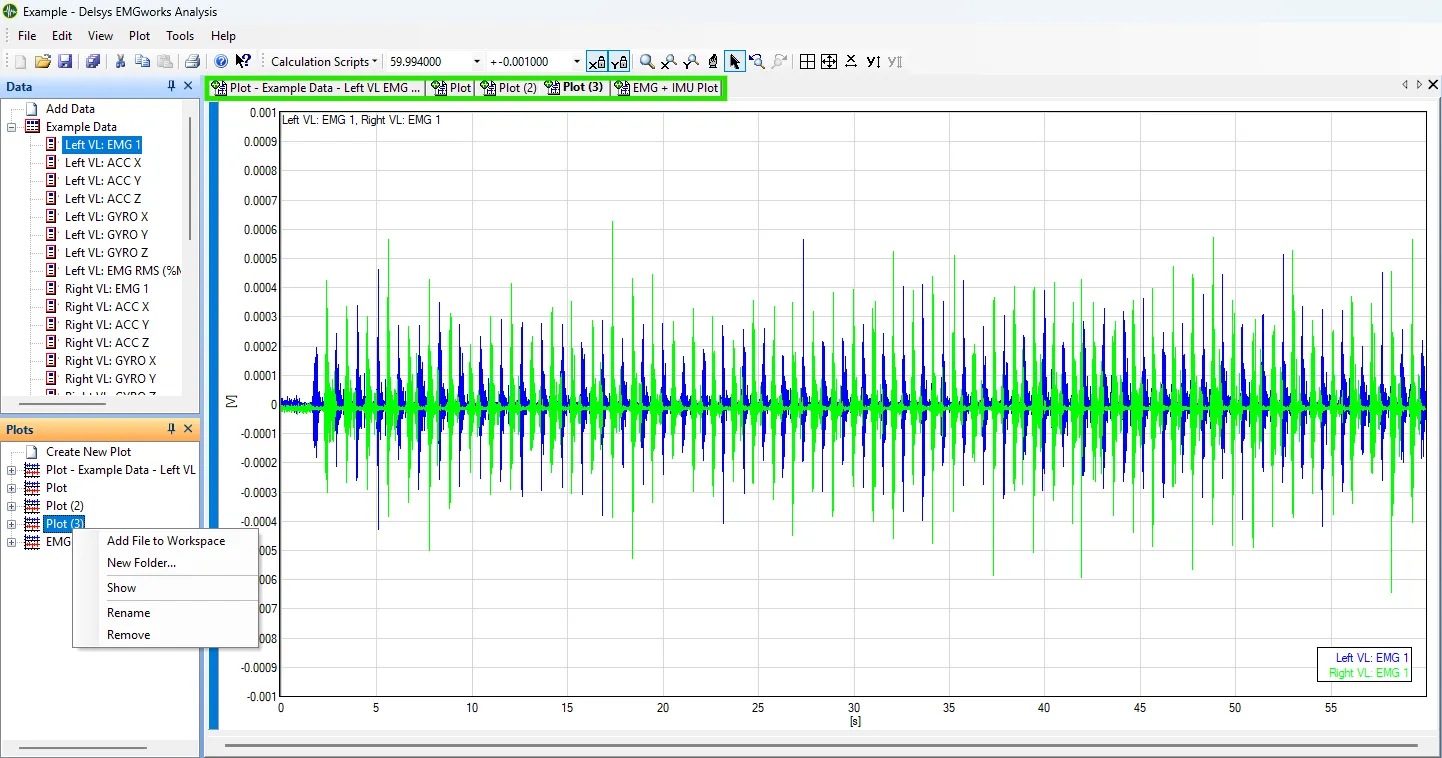
Swap between open plots by clicking through the tabs of the plot names at the top
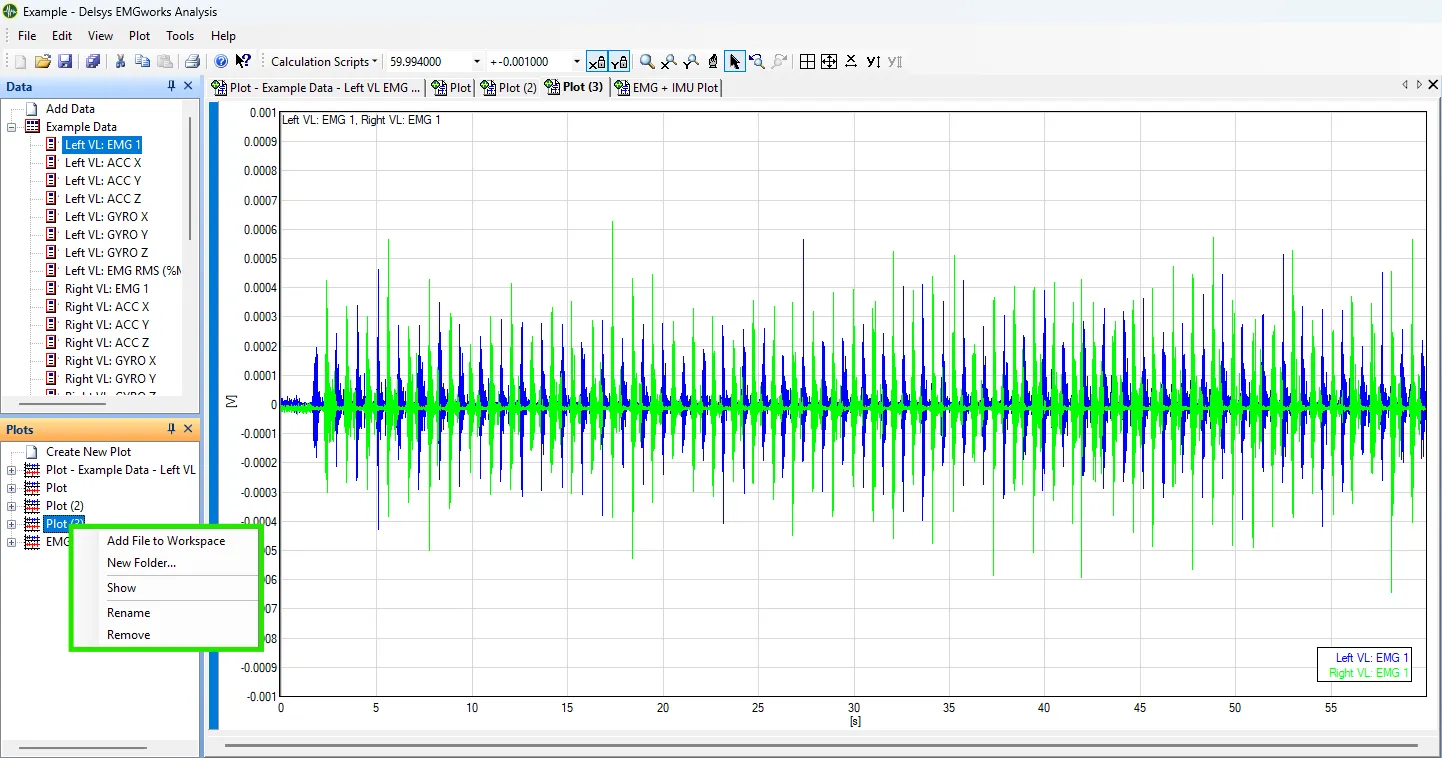
Select a plot from the plot panel, then right-click in the plot.
This gives the option to show, rename, or remove plots.
Step 6: Calculation Scripts
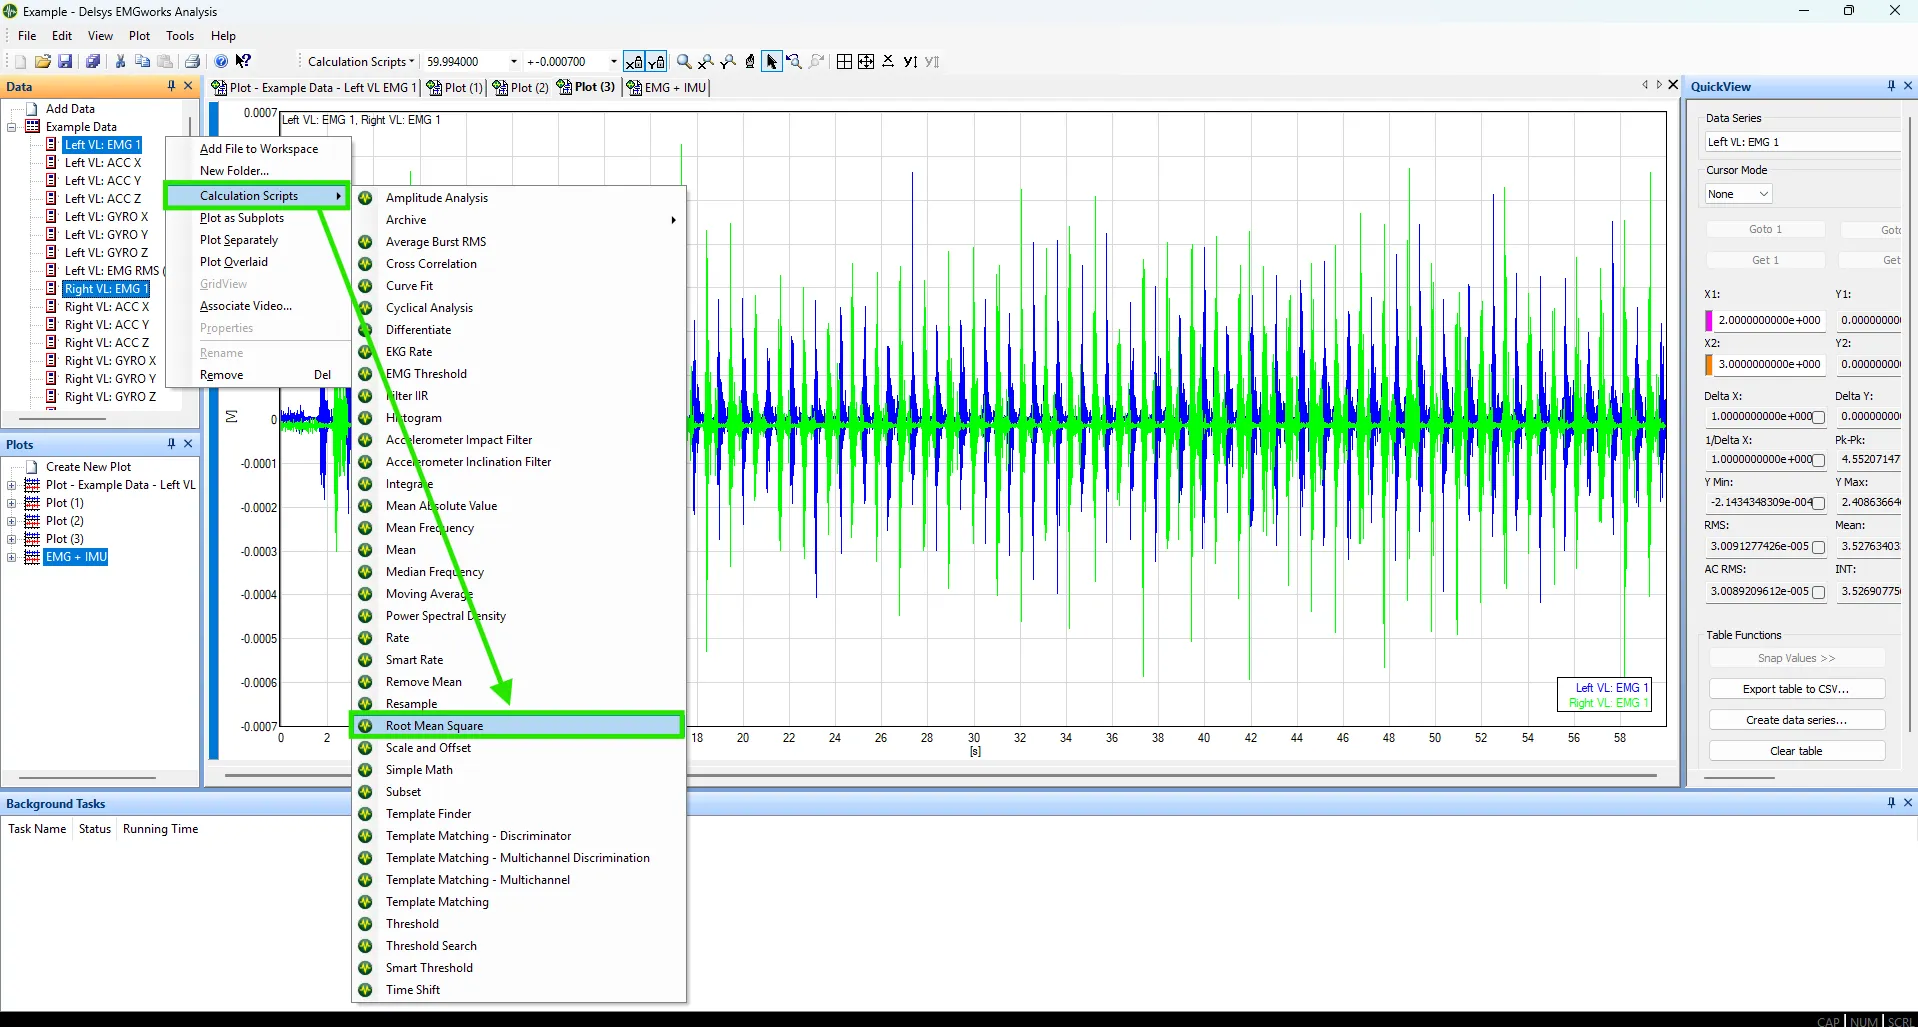
Select the data channel(s)
A calculation script can be applied to multiple data channels at a time.
Right-click anywhere in the data panel, then hover your mouse over Calculation Scripts.
Left-click the calculation script you want to perform.
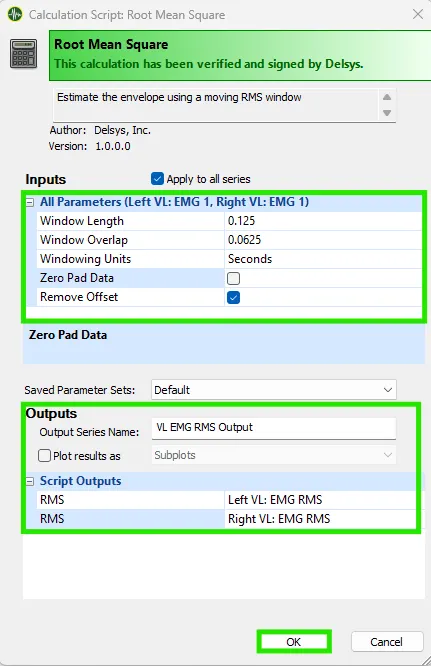
A pop-up window will appear with options.
Adjust calculation script parameters and output names, then click OK once finished to run the calculation.
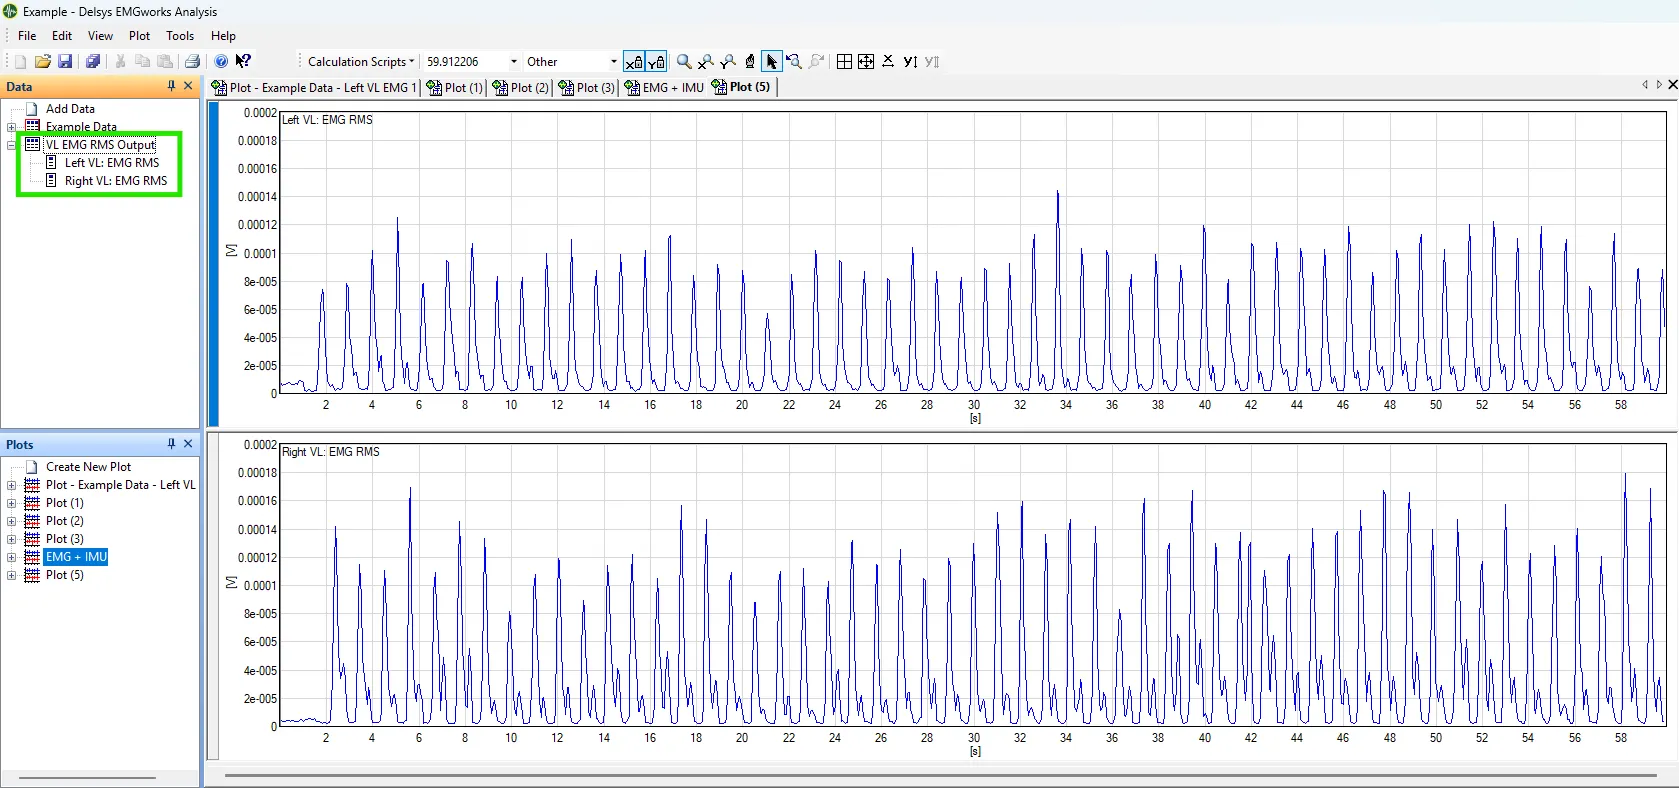
Data that has had a calculation script applied will appear in the data panel with a logo with a black border.
Data that has had a calculation script applied will appear in the data panel with a logo with a black border.
Information
For more information on the calculation scripts and the parameters, choose Help > Help Topics. This opens an extensive guide to EMGworks Analysis, offering in-depth details on how the different calculation scripts function.
Step 7: Plot Functions and QuickView Metrics
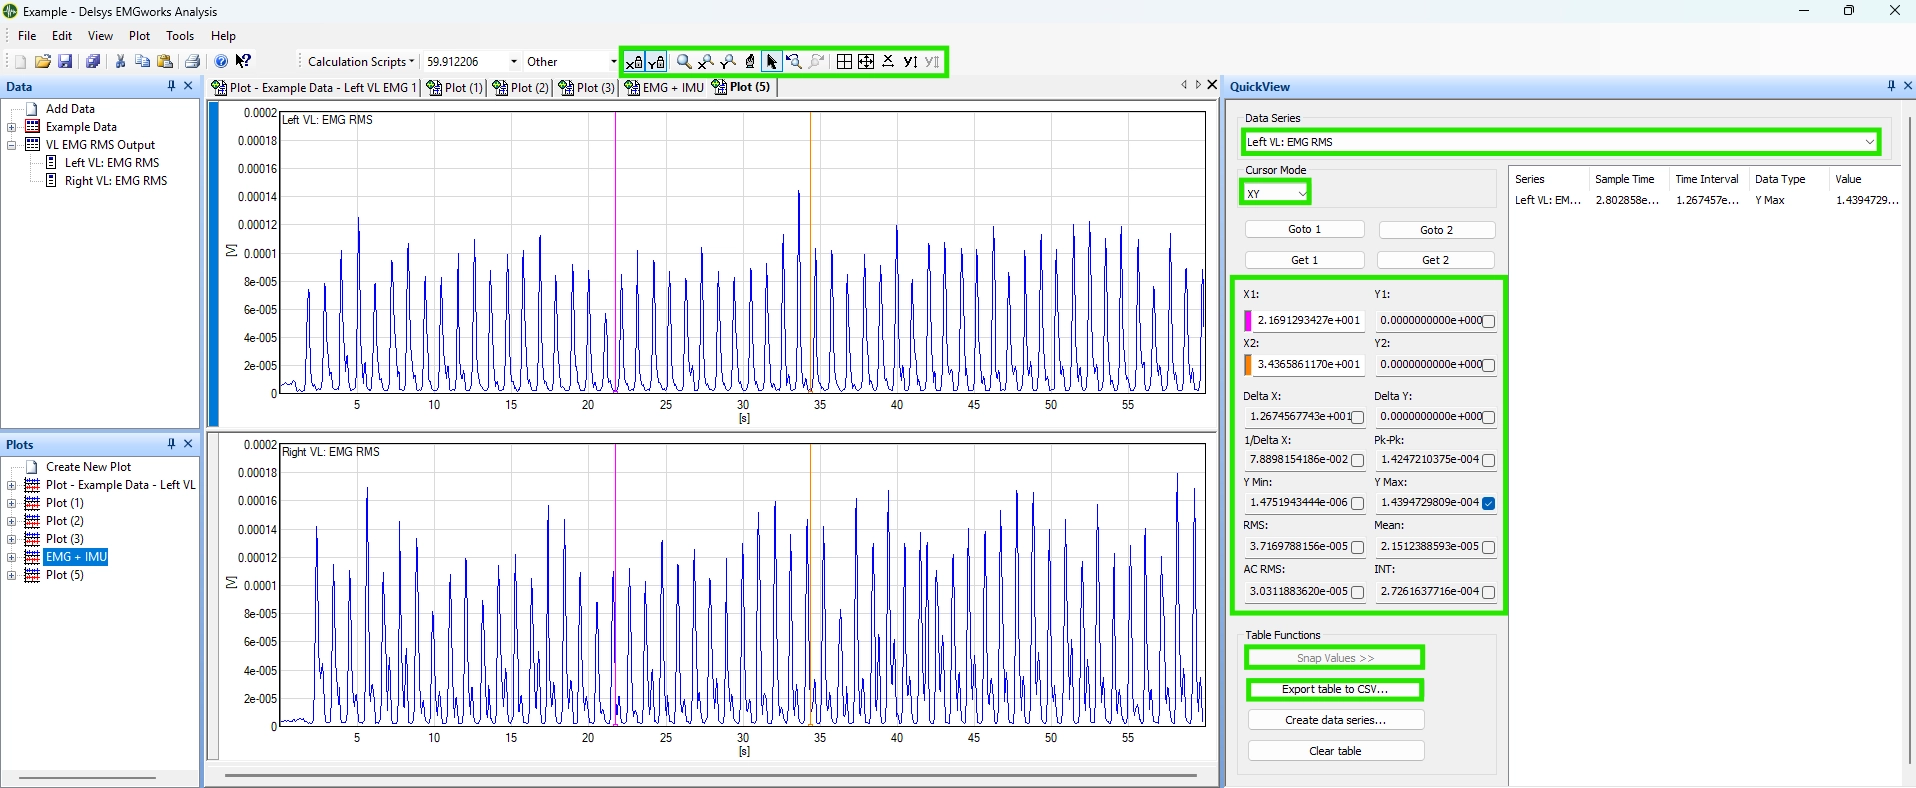
The toolbar at the top has plot zoom and drag functions to more easily visualize your data
The QuickView pane on the right hand side offers the ability to get quick analytics
Choose the data series of interest
Set the cursor mode, then drag the magenta and orange cursors around the section of data that you’re interested in
Select the metric(s) that are desired
Click Snap Values to add the metrics to the metrics table
Once all metrics are added, click Export table to CSV… for further processing
This exports only the data added to the metrics table
Step 8: Data Export
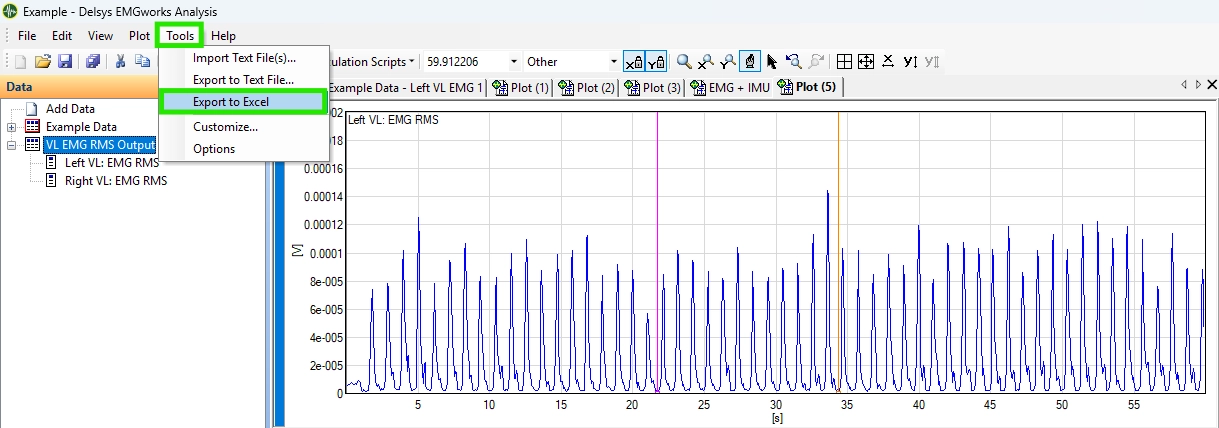
Once you are finished plotting data and running calculation scripts, you can export the data for further processing
Select the data file(s) you wish to export
Note: You cannot export individual channels of data, you must export the parent data file instead
Choose Tools, then pick your export type
Common Analysis Techniques
Amplitude Analysis
Timing Analysis
FAQ’s
I have the QuickView Option Selected, but I can’t see the panel for it. Where can I find it?
The QuickView panel is a movable window. Check to see if there are any pop-up windows. If found, drag the pop-up window into EMGworks Analysis to add it back to the main screen. If you need additional support, reach out to Delsys Support
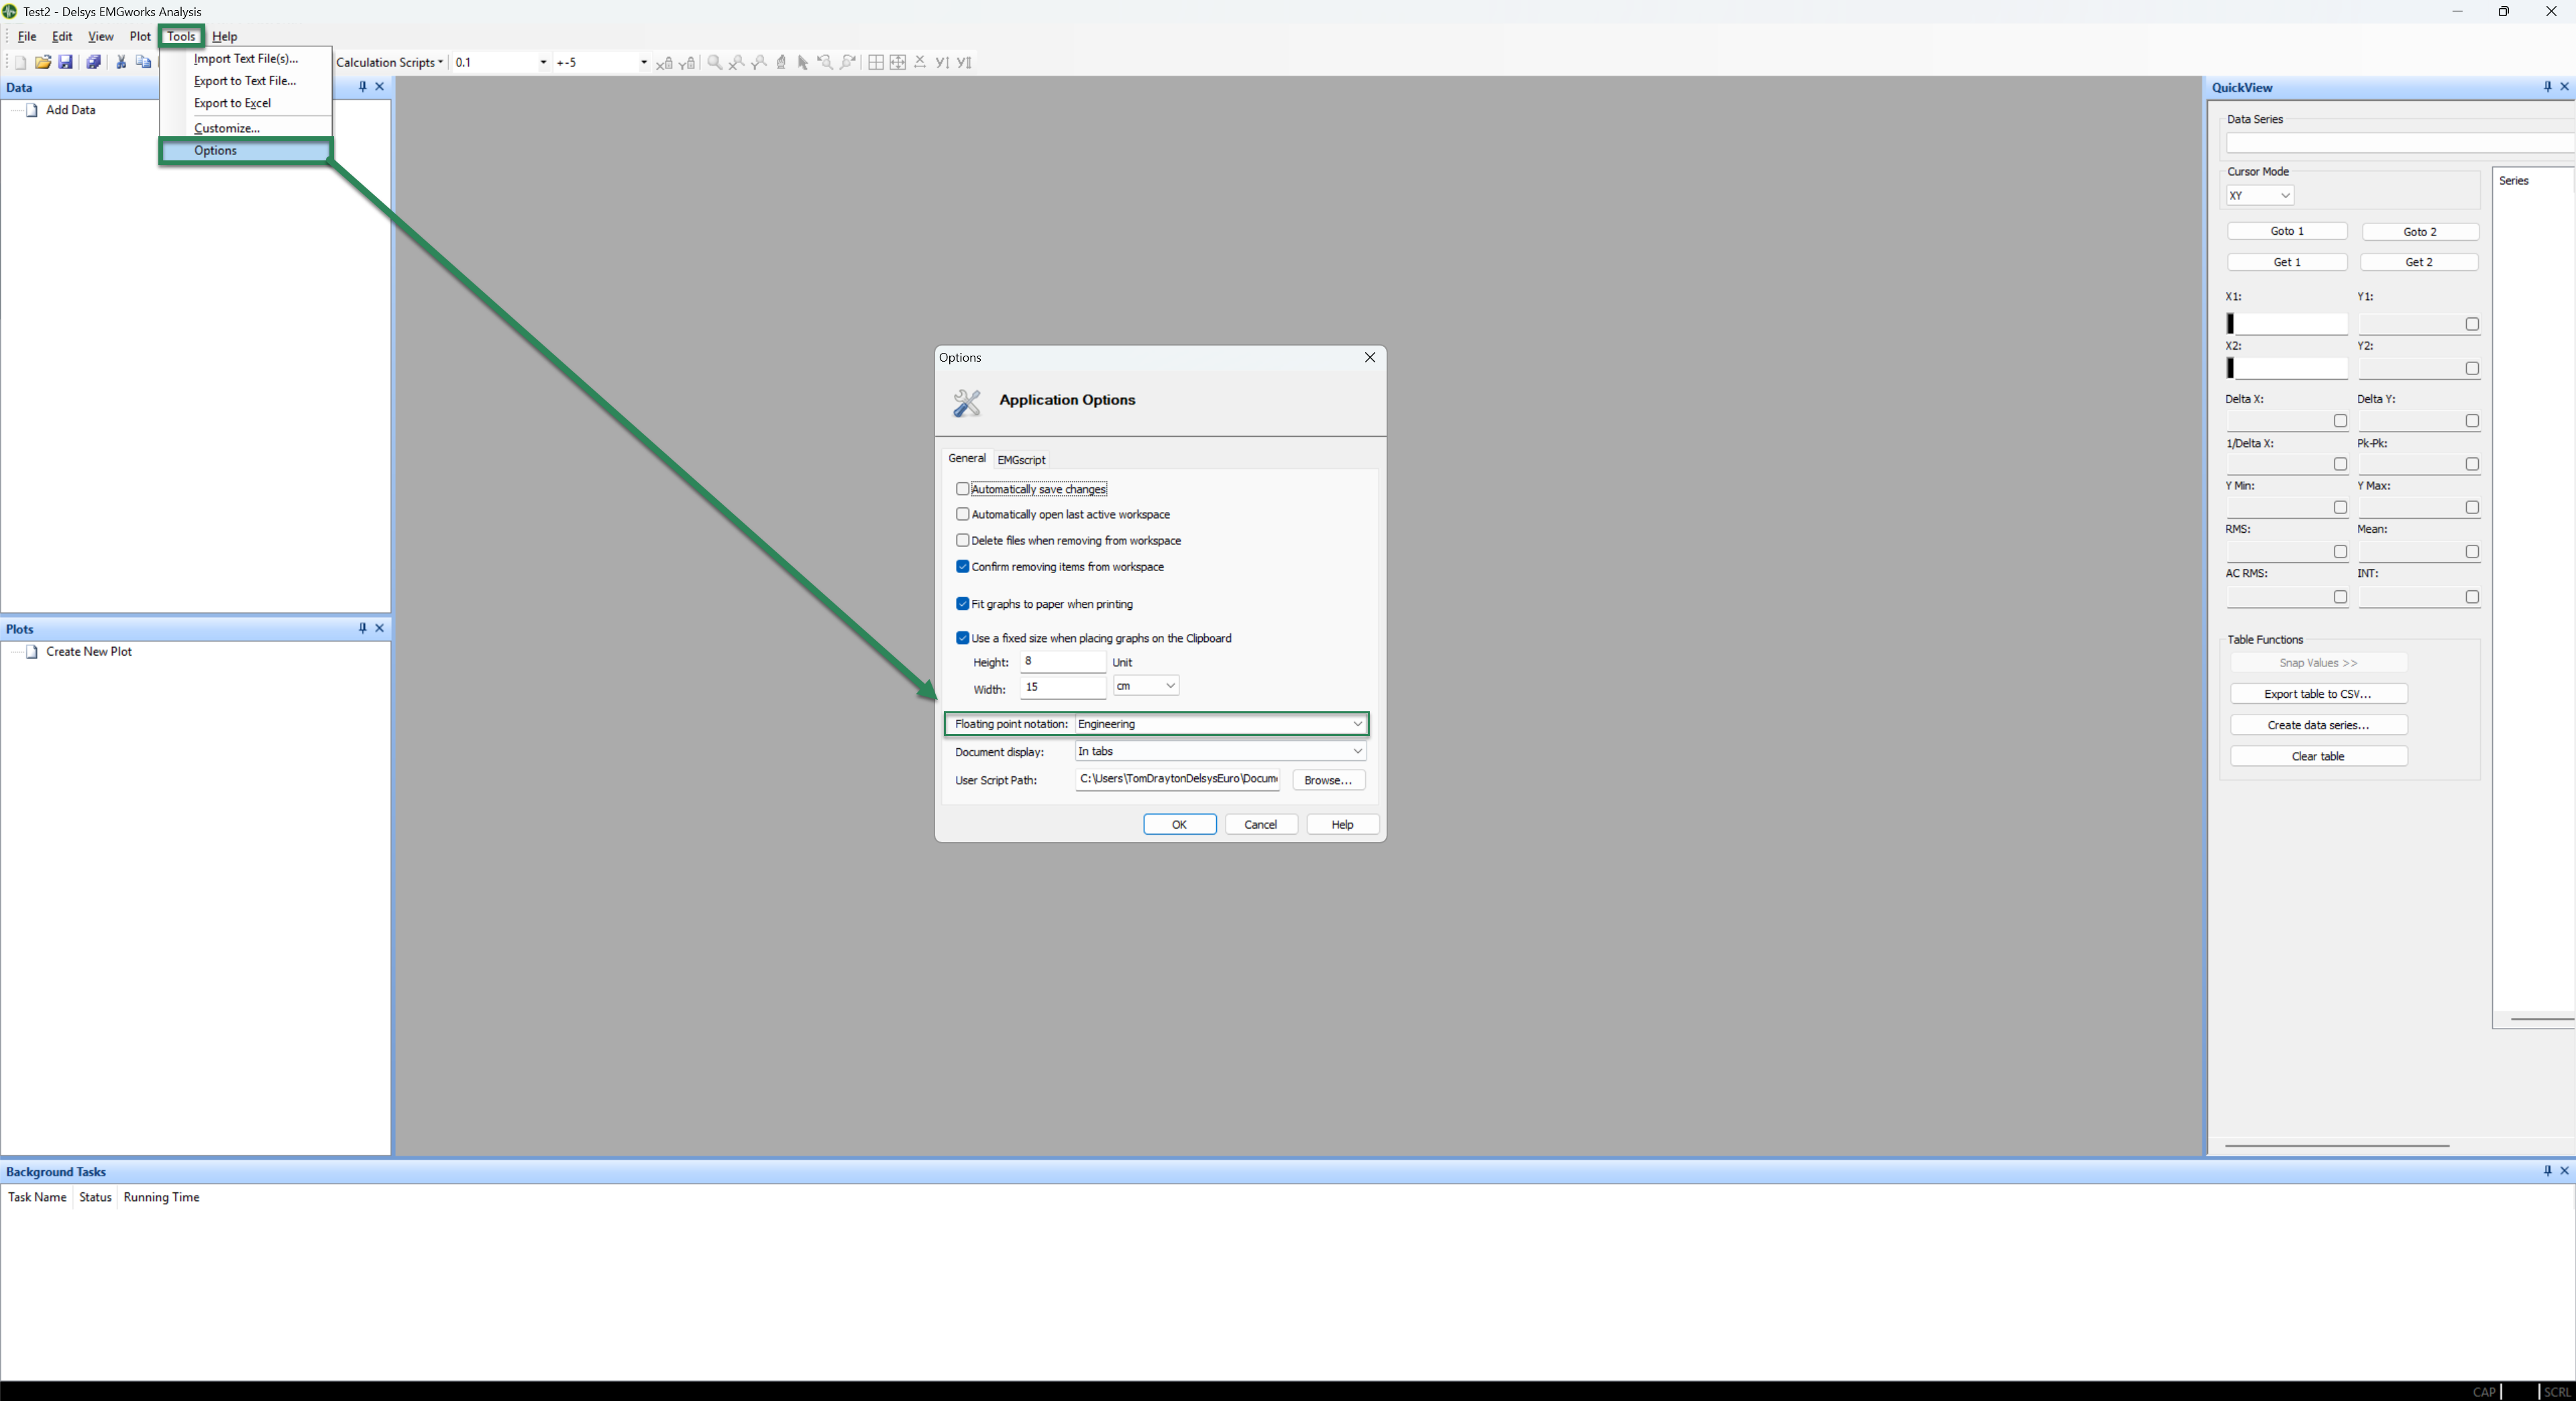
How do I change the scientific notation in the QuickView Pane?
To change the scientific notation in the QuickView panel, navigate to Tools > Options, a new window will appear. In the new Options window, navigate to the Floating point notation drop-down and select your preferred notation.
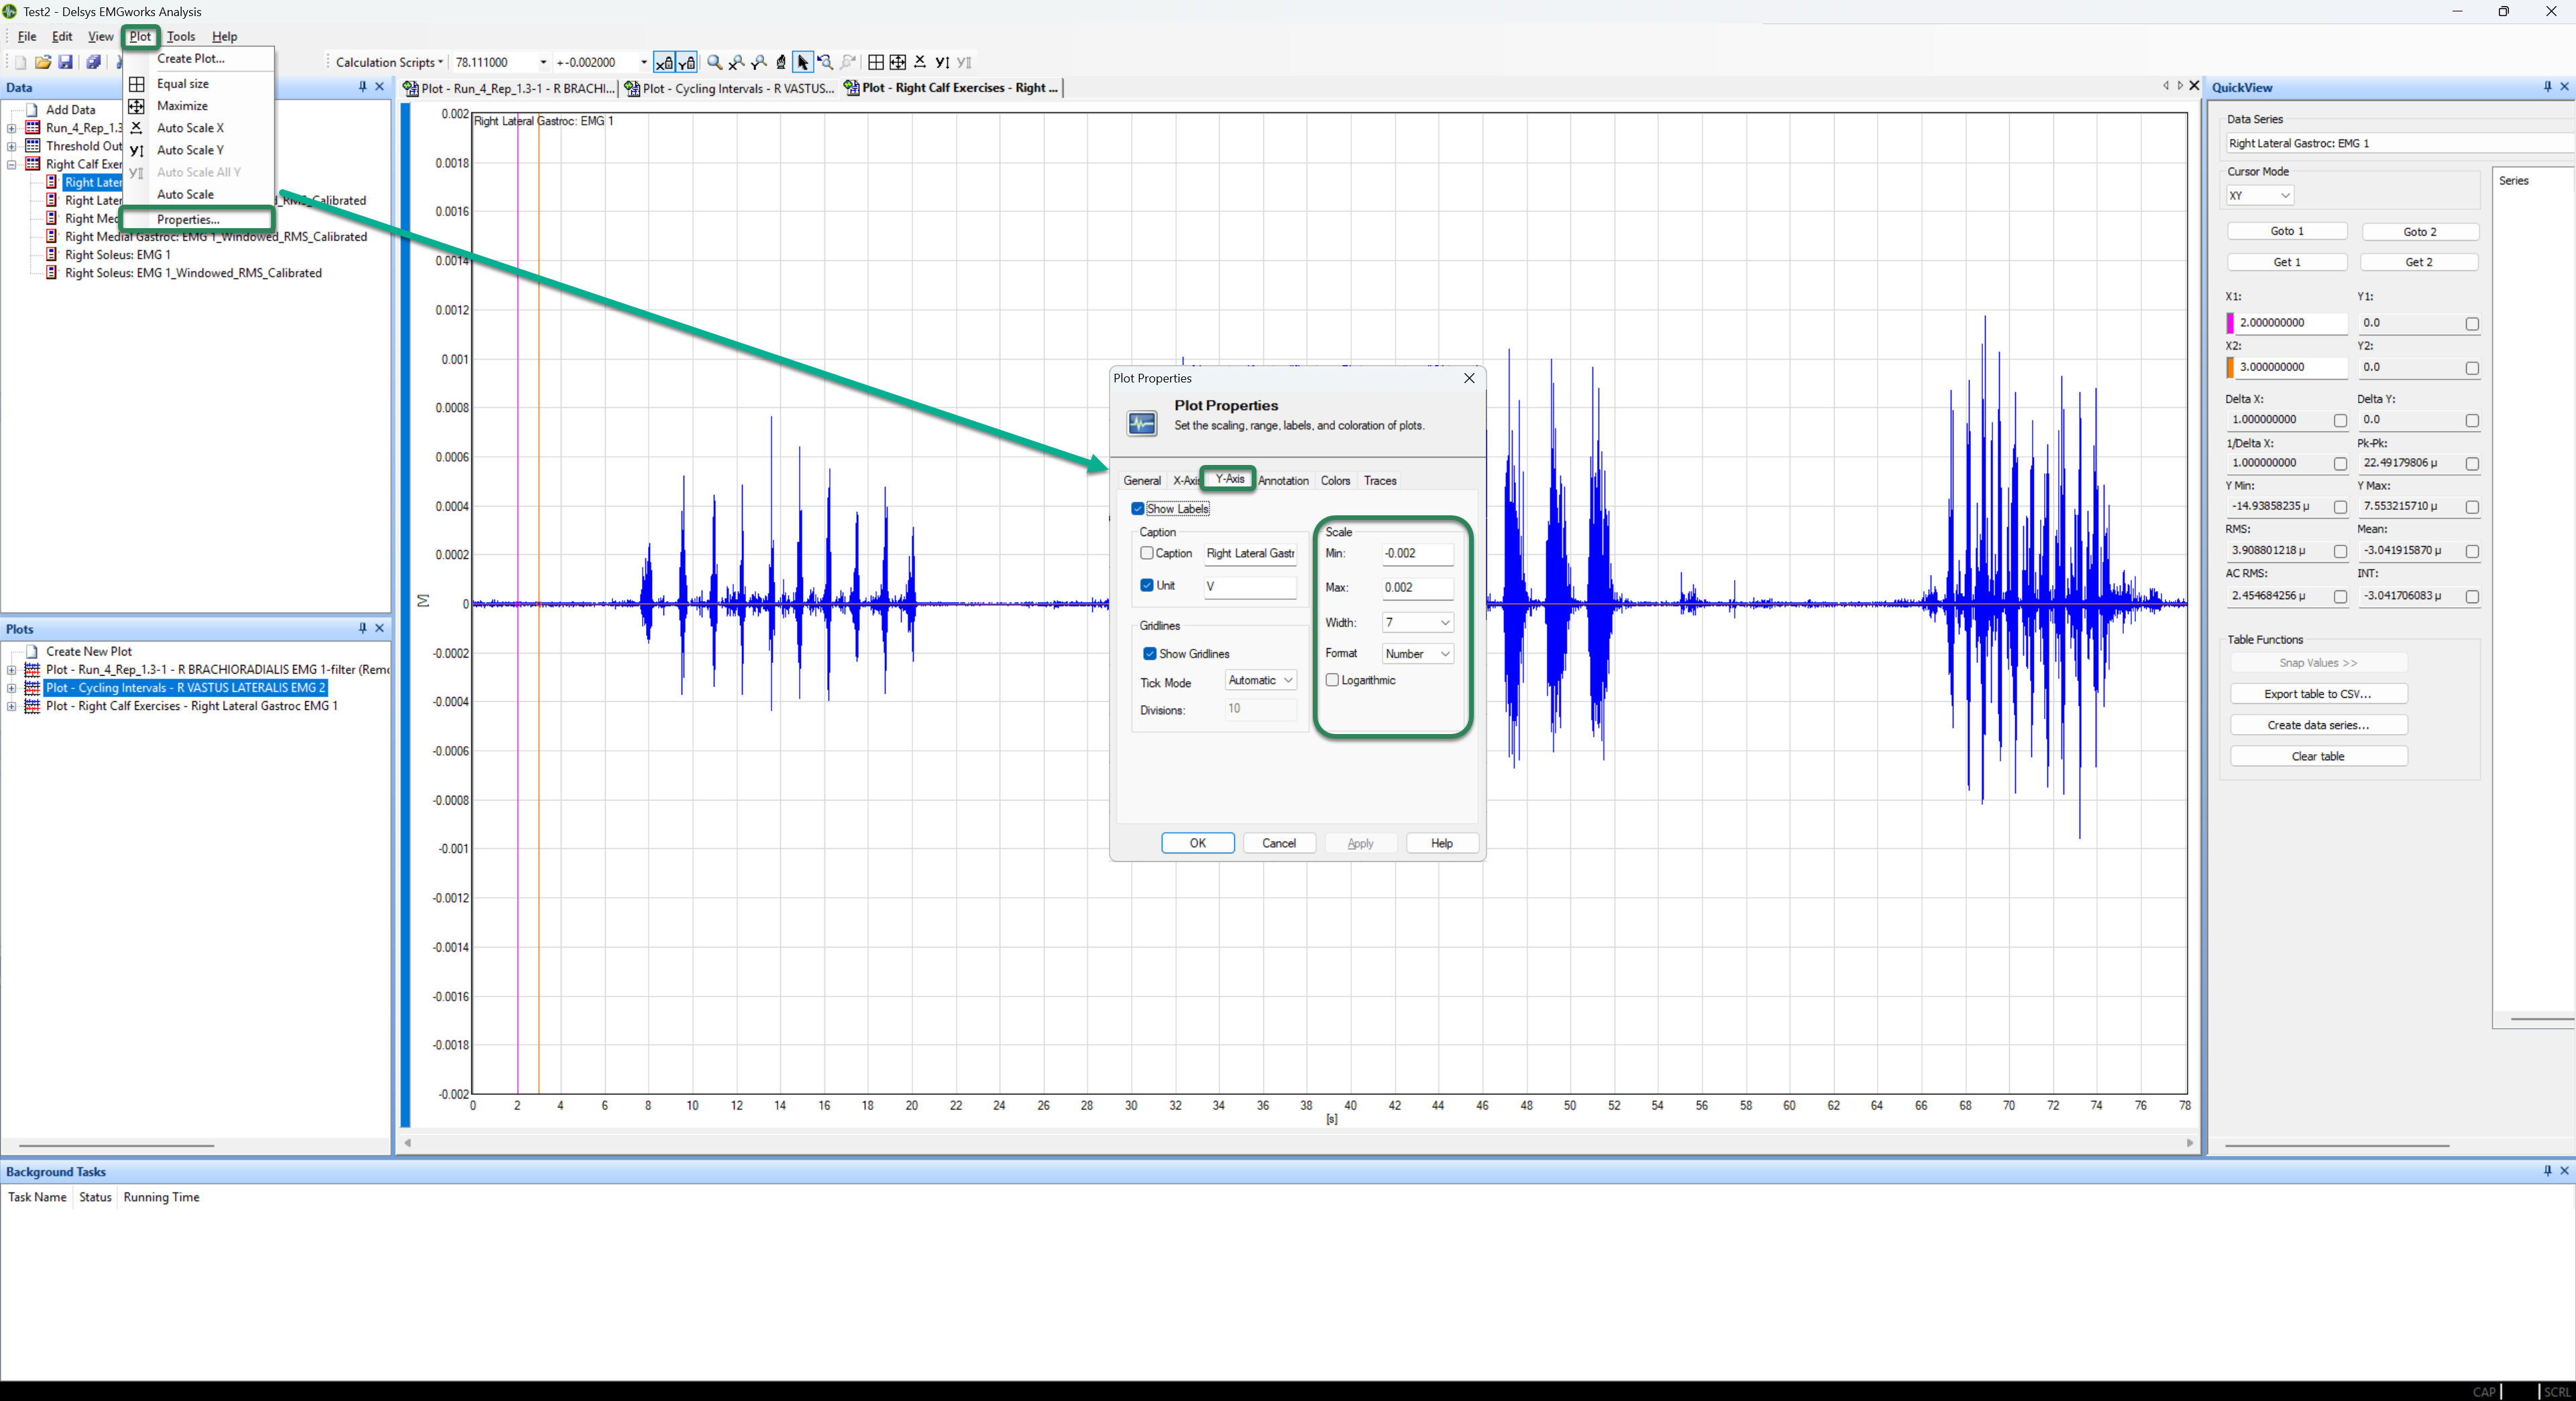
How do I change the Y-Axis units on my graph?
To change the units in your graph navigate to Plot > Properties. In the Plot Properties window, you can customise how each of your graphs are visualised.
DOC-682-1-0