Overview
This guide walks you through the Cyclical Analysis report in Trigno Analytics and shows how to evaluate muscle activity during repetitive movements such as walking, running, or cycling. You’ll learn how to select the appropriate template, configure report properties, and apply Event Marker Groups to define the start and end of each user-defined cycle. The guide also outlines how to generate the Trigno Analytics Cyclical report, adjust the report’s visual display, organize multiple pages within a project, and export the final results to assess muscle activity patterns, consistency, and potential imbalances across movement cycles.
Information
This article refers to Trigno Discover version 2.1. Please note that the user interface may vary depending on the version you have installed. You can find your current version of Trigno Discover in the top left corner of the application window.
System Requirements
Material/Tool | Description |
|---|---|
Software | Trigno Discover 2.1+ |
Hardware: System | Trigno Centro; Trigno Lite; Trigno Research Base Station |
Firmware: System | Trigno Centro: 06-05-00 | 04-01 + Trigno Lite: 02-02 + Trigno Research Base Station: Digital: 2919 | 1506 | 0806 | 2008 | 0000 Analog: 2919| 1506 | 0806 | 2008| 0901 |
Hardware: Sensors | Avanti-Style Sensors |
Firmware: Sensors | Avanti-Style Sensor: 40-49 Maize Sensor: 60-29 |
Operating System | Windows 11 |
PC Specifications |
|
Step-by-Step Instructions
Step 1: Preparing Your Data
Before using Trigno Analytics, ensure the collected data is prepared with Event Marker Groups and includes a normalized/MVC trace (see the Trigno Analytics: Preparation article).
Trigno Analytics is designed to work with recorded data. (See Trigno Discover: Data Collection & Review for more details.)
Important
Trigno Analytics functions best with a normalized or RMS trace. Normalization can be applied to collected data by selecting the Normalize icon in the Review tab.
Step 2: Open Trigno Analytics
Once the data is collected and prepared, select the Trigno Analytics Icon at the top of the data collection pane.
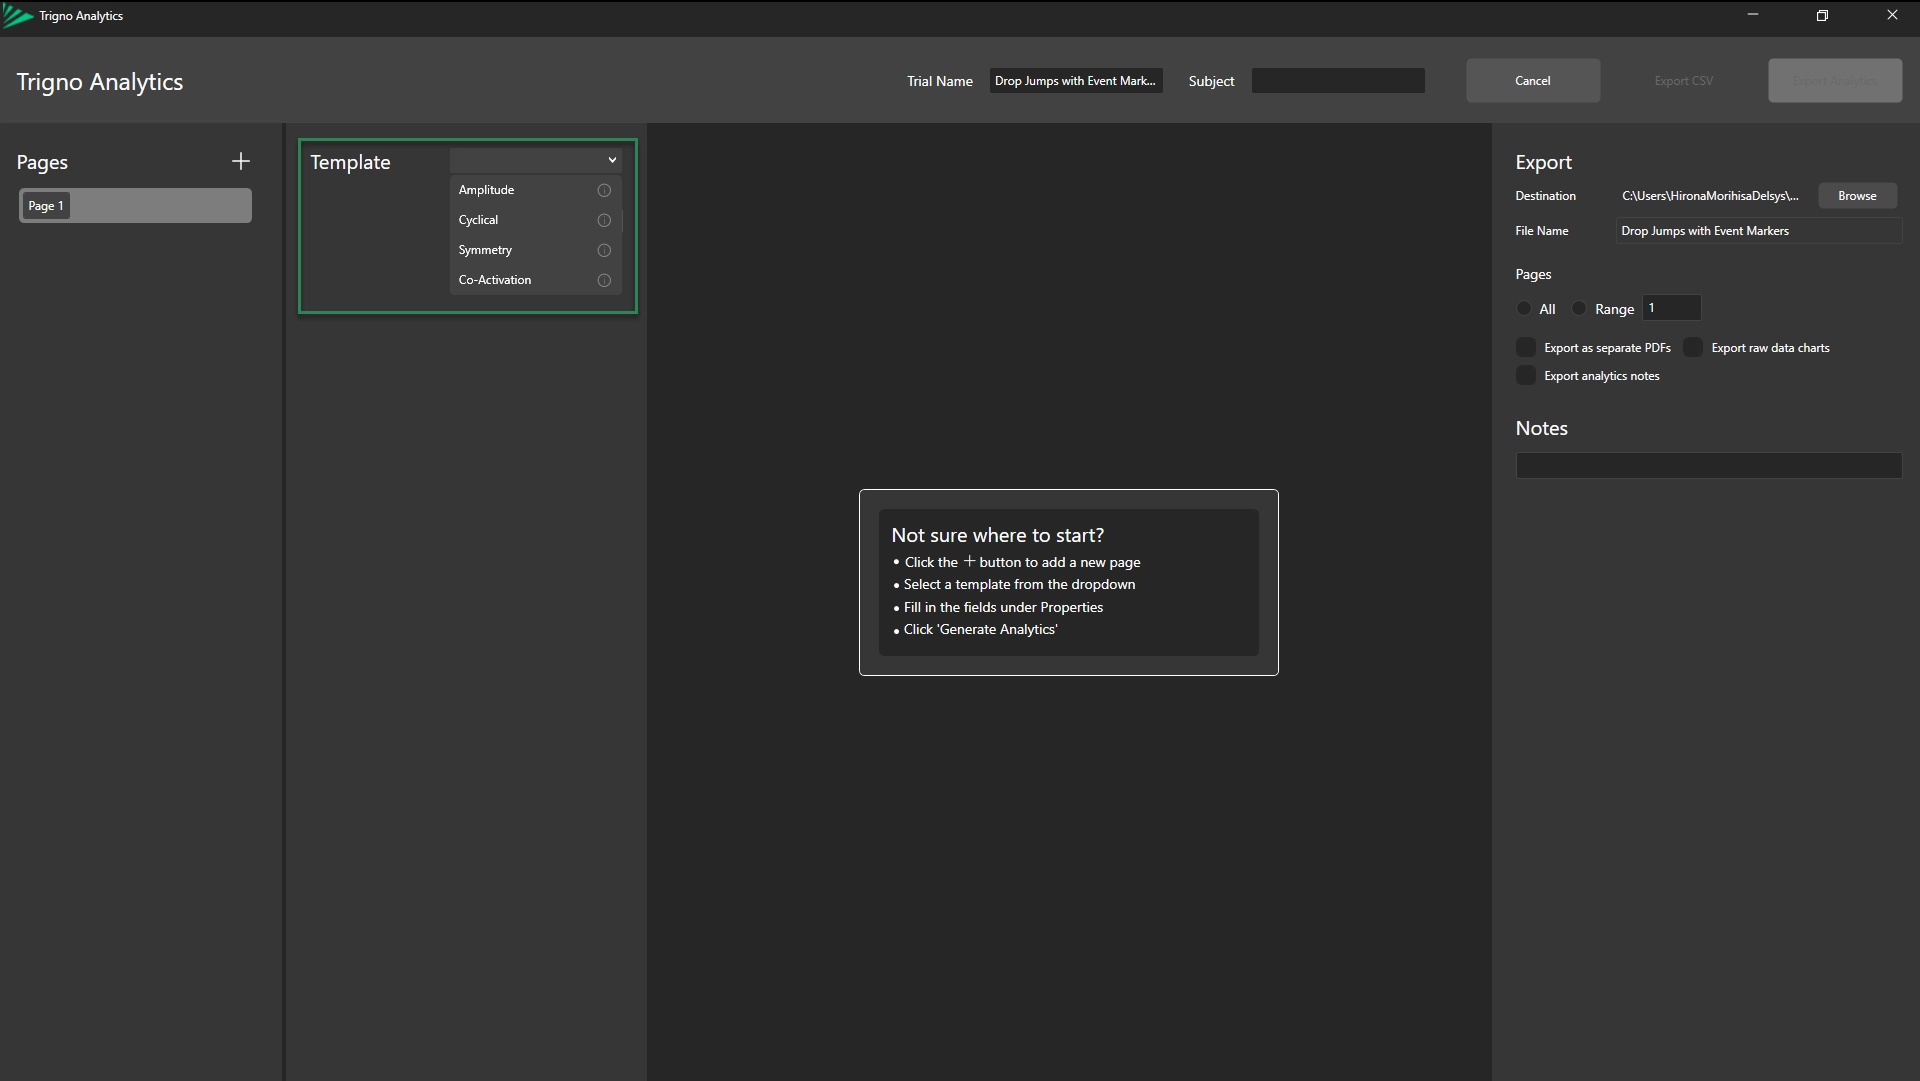
Step 3: Choose Template
From the drop-down menu next to Template, select Cyclical.
Information
Users have the option to select multiple report type options. For more information on each report type, refer to the Trigno Analytics Getting Started Series.
Step 4: Set Properties
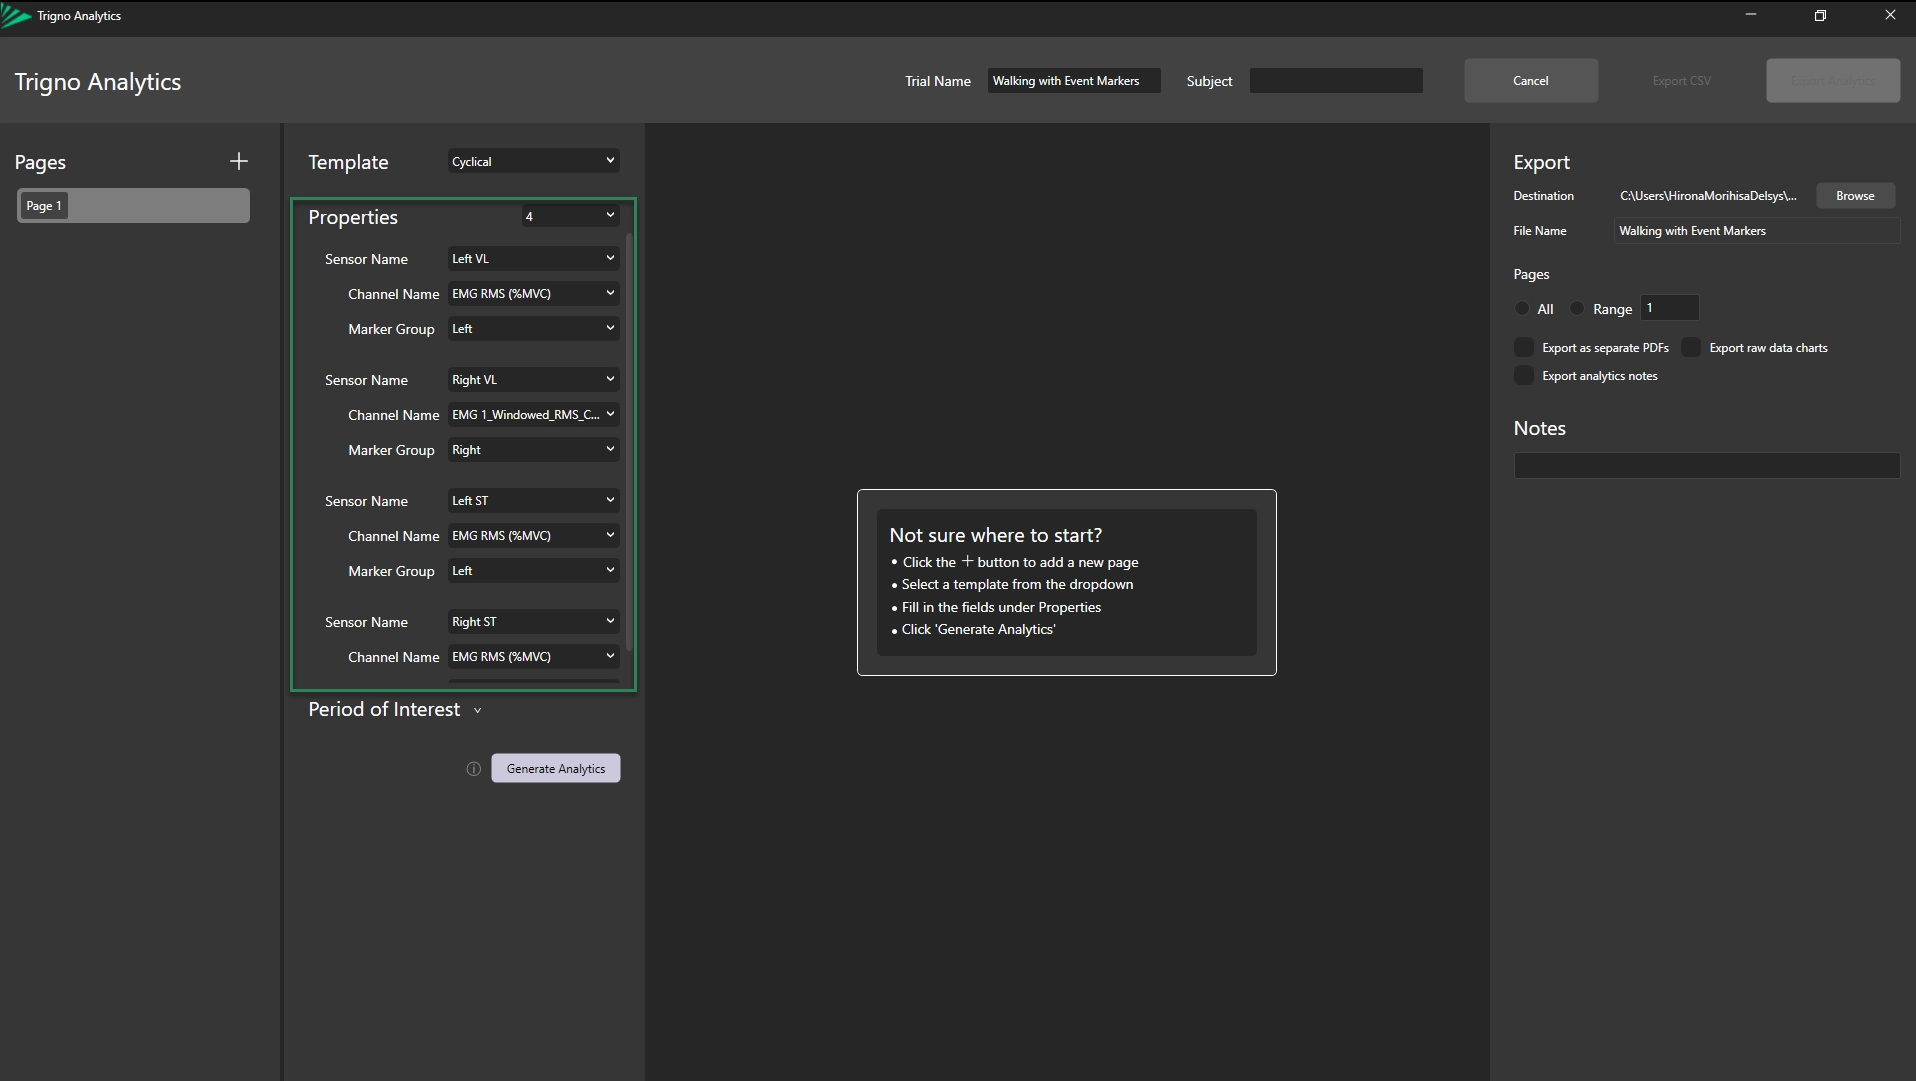
After selecting the report type, the Properties menu will appear, where you can choose
Sensor Number: Select the number of muscles (1, 2, or 4) you would like to display in the report using the drop-down menu.
Sensor Name: Select which sensor(s) to include in the report using the drop-down menu.
Channel Name: Select the specific signal channel from each selected sensor to display in the report (e.g., EMG, Accelerometer axis, Gyroscope axis, normalized EMG) using the drop-down menu.
Marker Group: Use the drop-down menu to select the Event Marker Groups for the report.
Information
When you select a Sensor Name, the Channel Name is set to EMG RMS (%MVC) by default. To choose a different Channel Name, use the drop-down menu. While you can select EMG or ACC channels, it is recommended to use normalized EMG data when generating the report.
If no marker groups are found, please create new marker groups. You can refer to the Trigno Analytics: Preparation Article for guidance.
Step 5: Set Period of Interest (Optional)
If you wish to specify a time range or rep range for analysis:
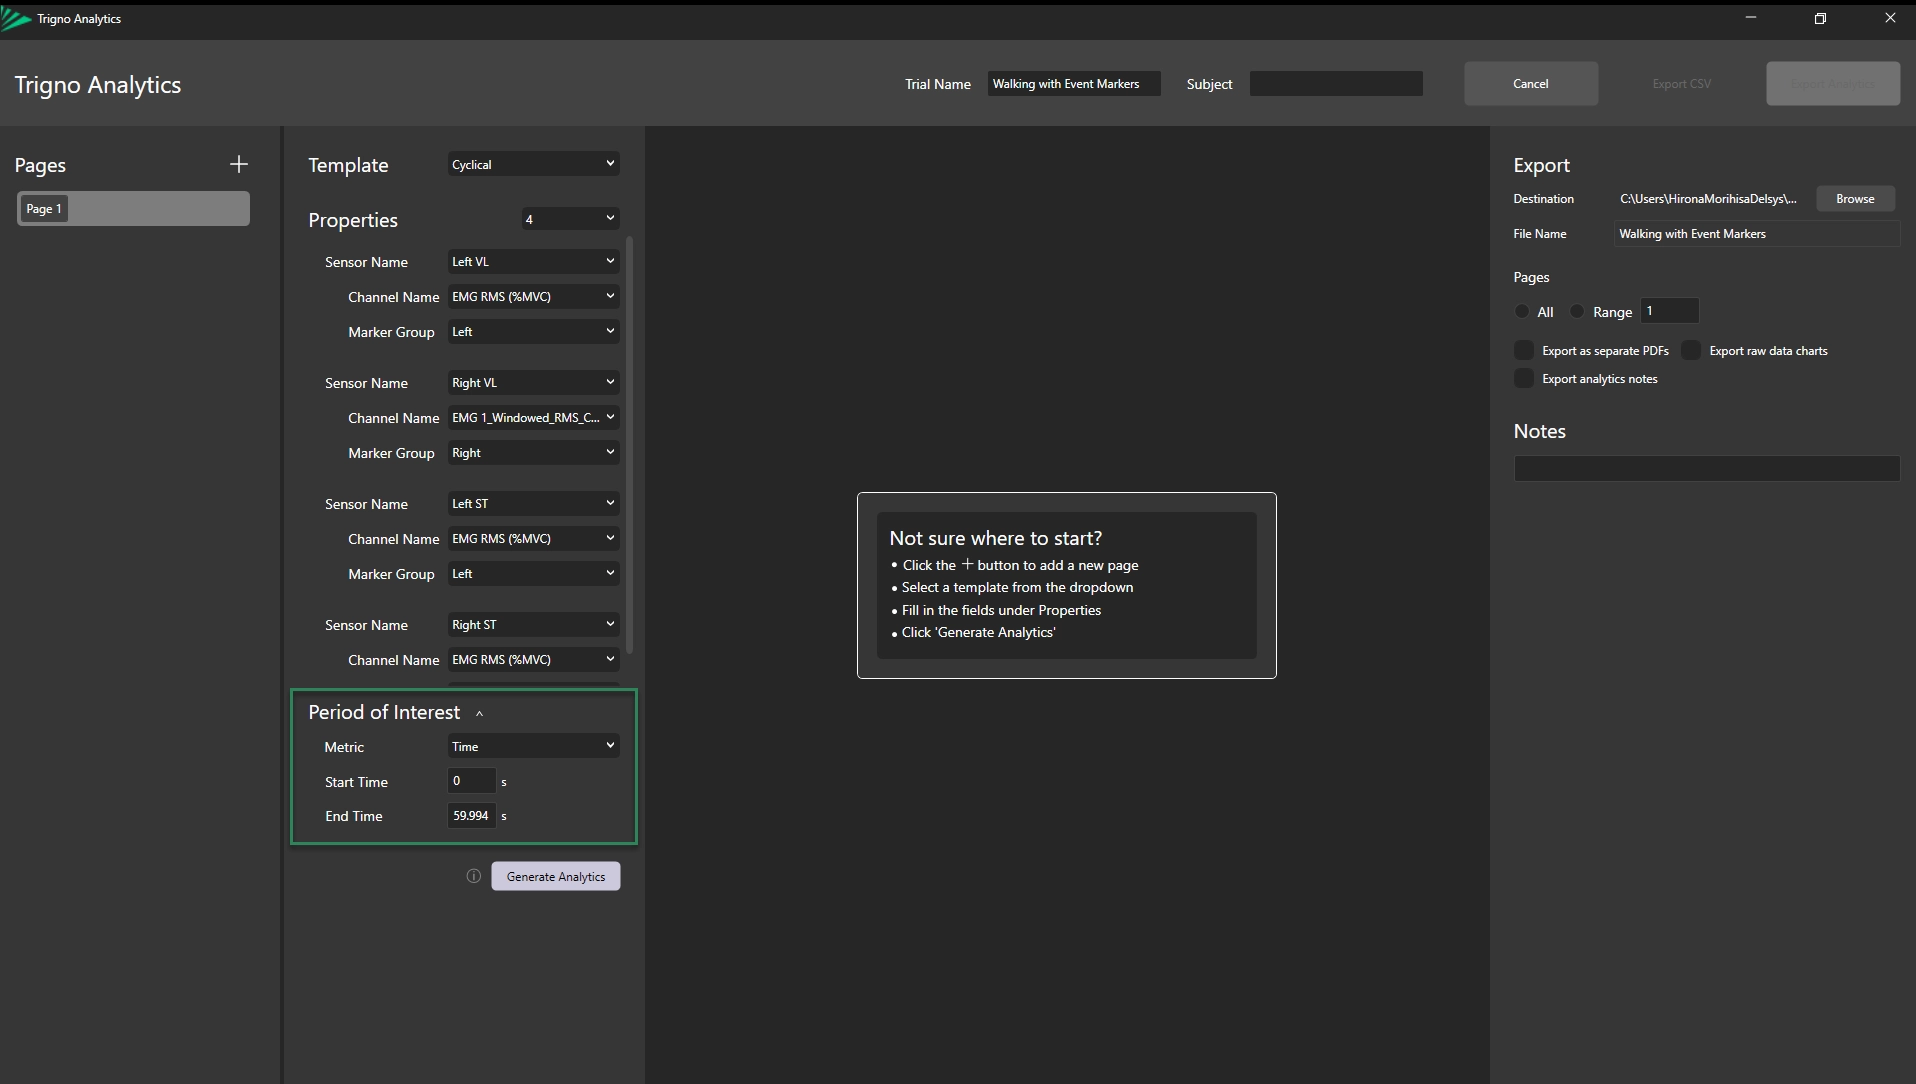
Open the Period of Interest menu, select the drop-down caret next to Period of Interest.
Choose a metric
Time: allows the selection of a time range within the trial for analysis.
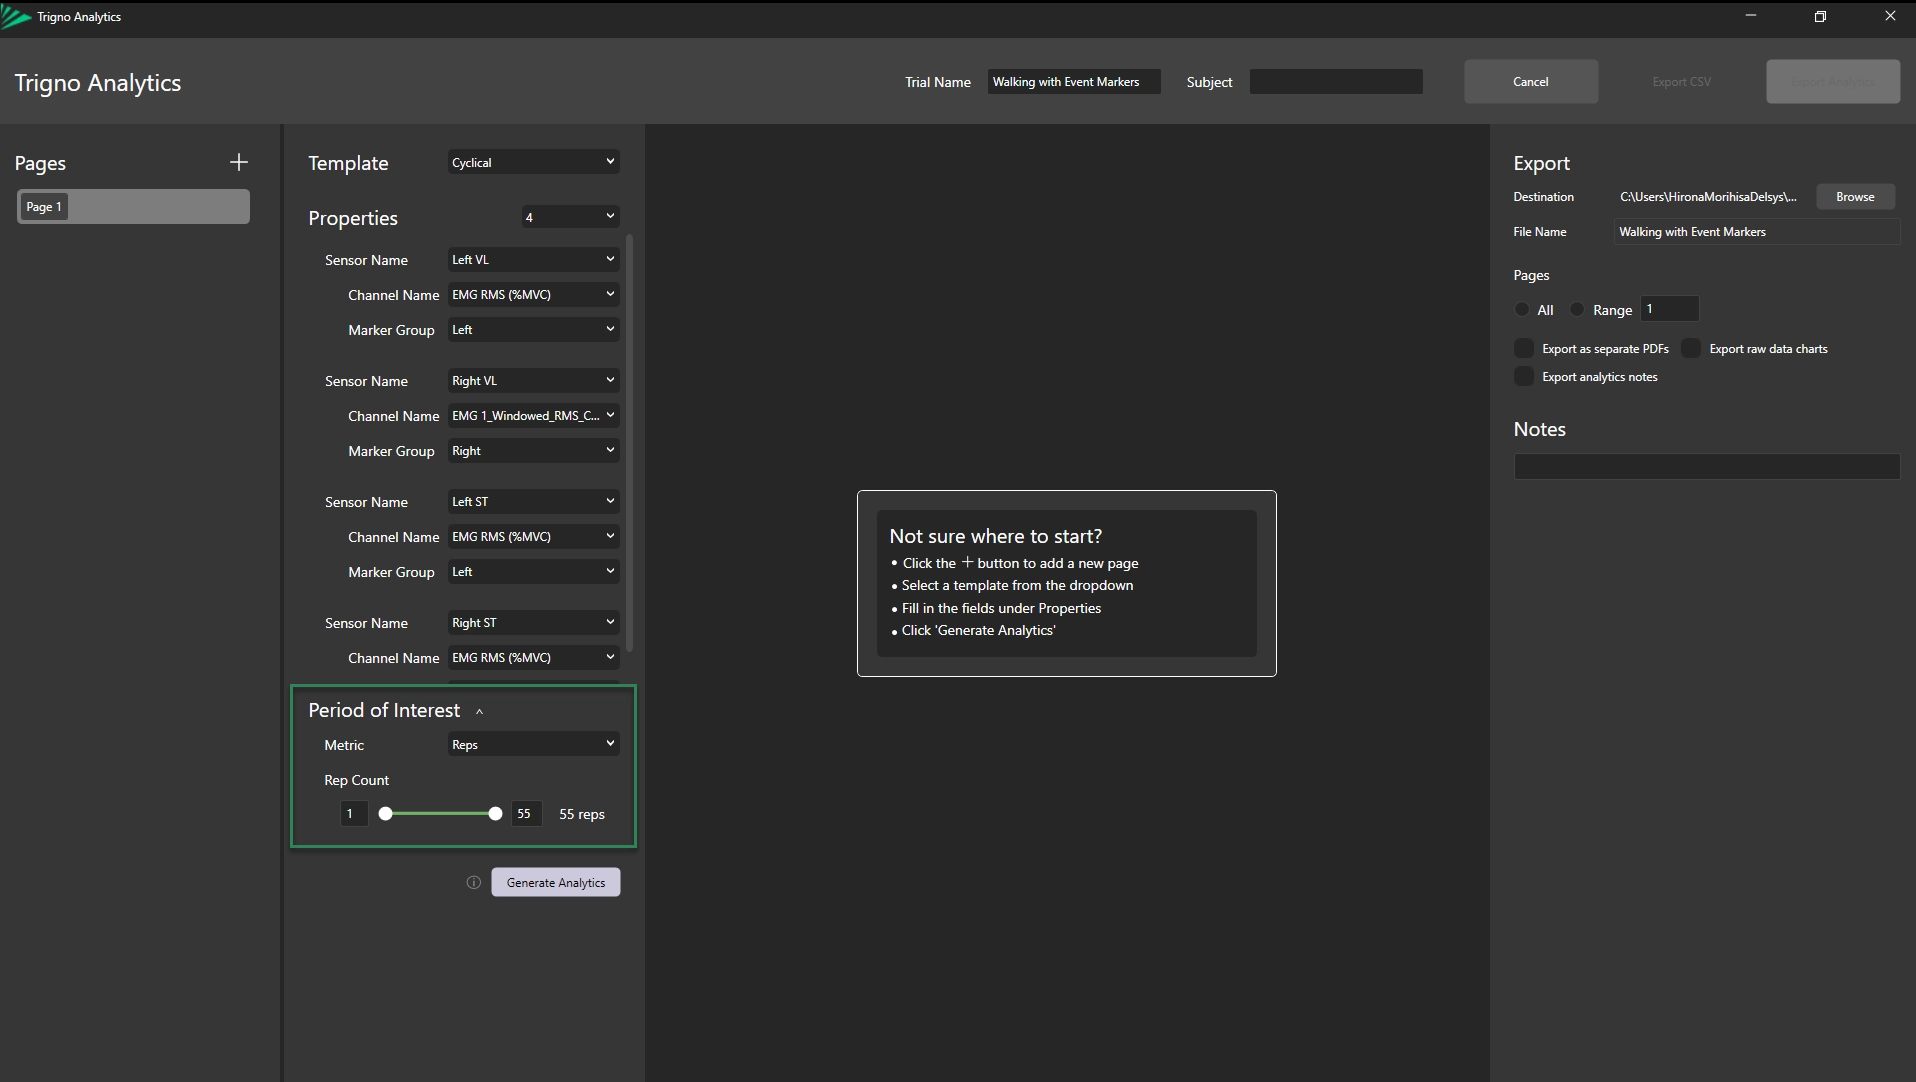
Reps: allows the selection of a rep range within the trial for analysis.
Information
The maximum number of reps available on the slider corresponds to the total marker pairs detected in the collected data. Reps are determined by the number of event marker pairs.
Specify a time, enter a Start Time and End Time in the format s.
The End Time field is automatically populated based on the total duration of the trial.
Specify a rep range, use the left and right slider handles to set the rep range for analysis.
Step 6: Create Report
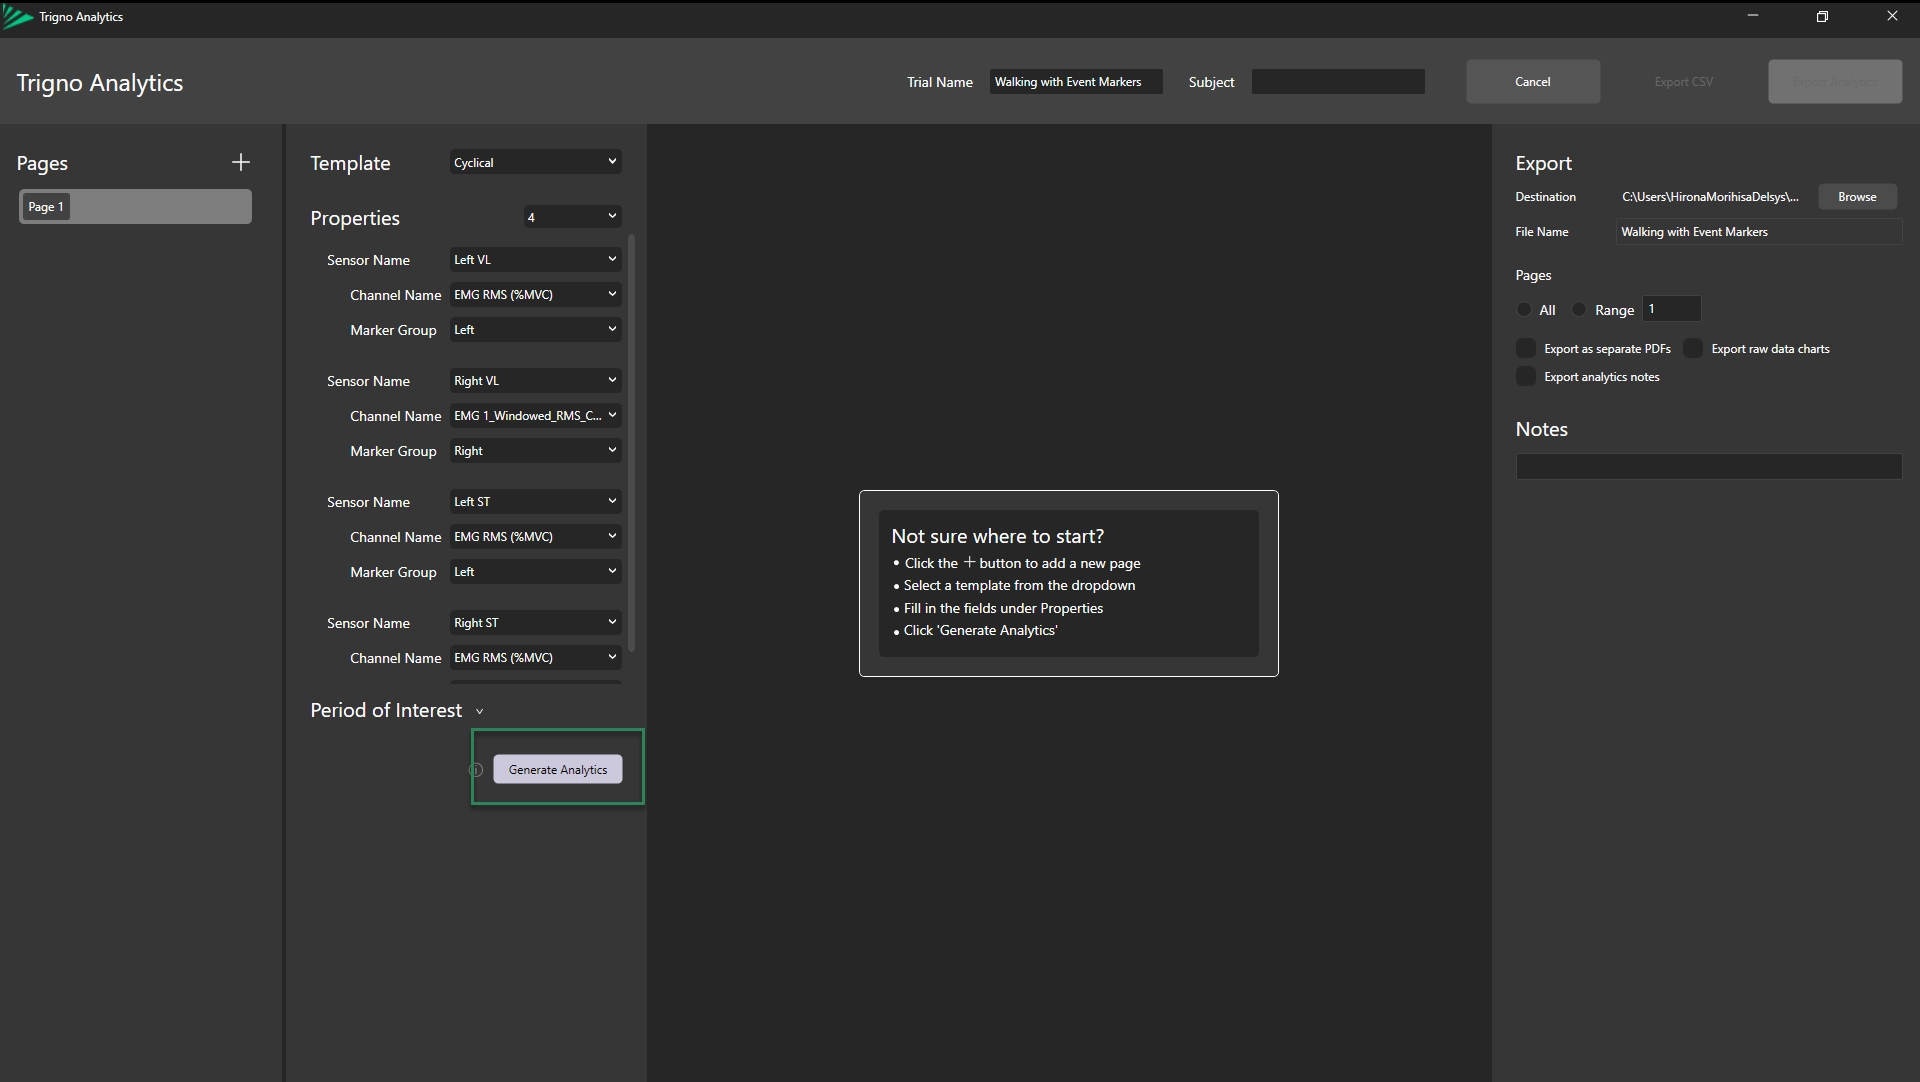
Once all configurations are set, click Generate Analytics to create the Cyclical Report.
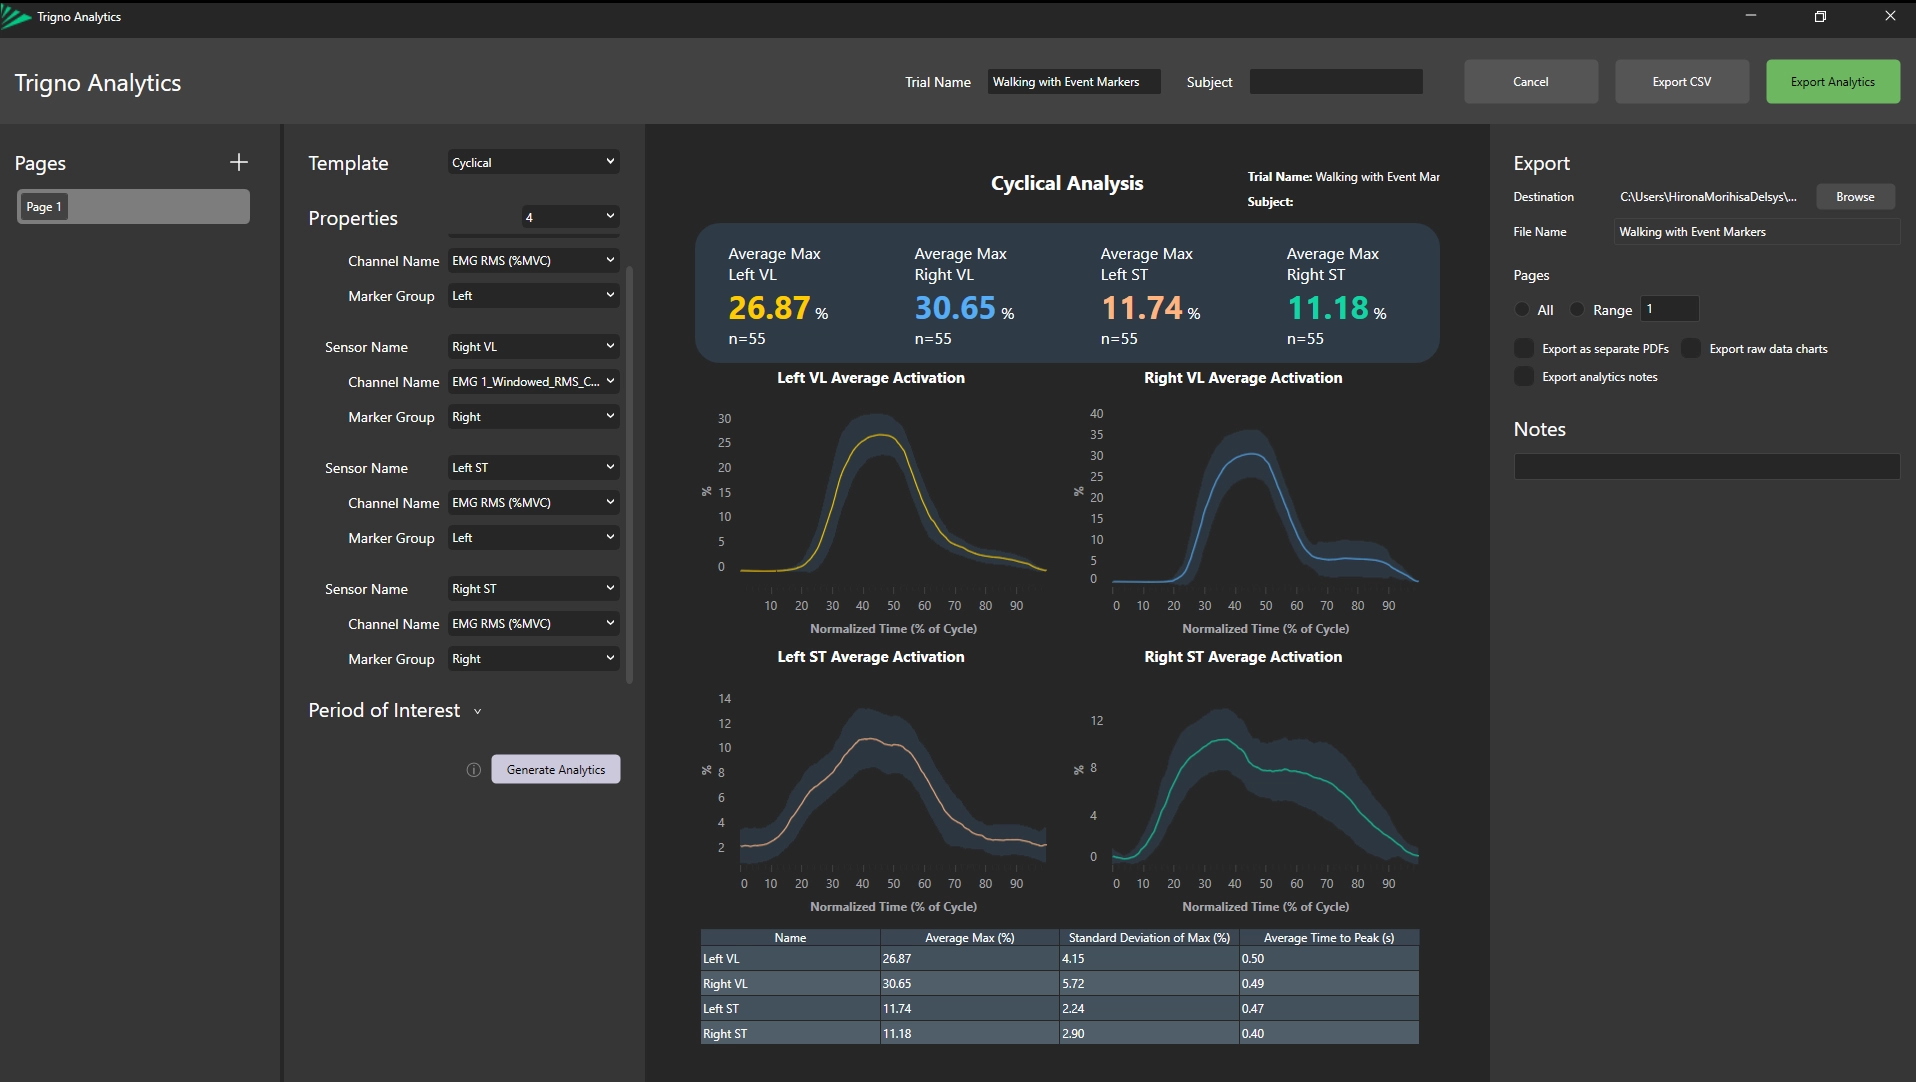
The Cyclical Analysis will appear in the panel
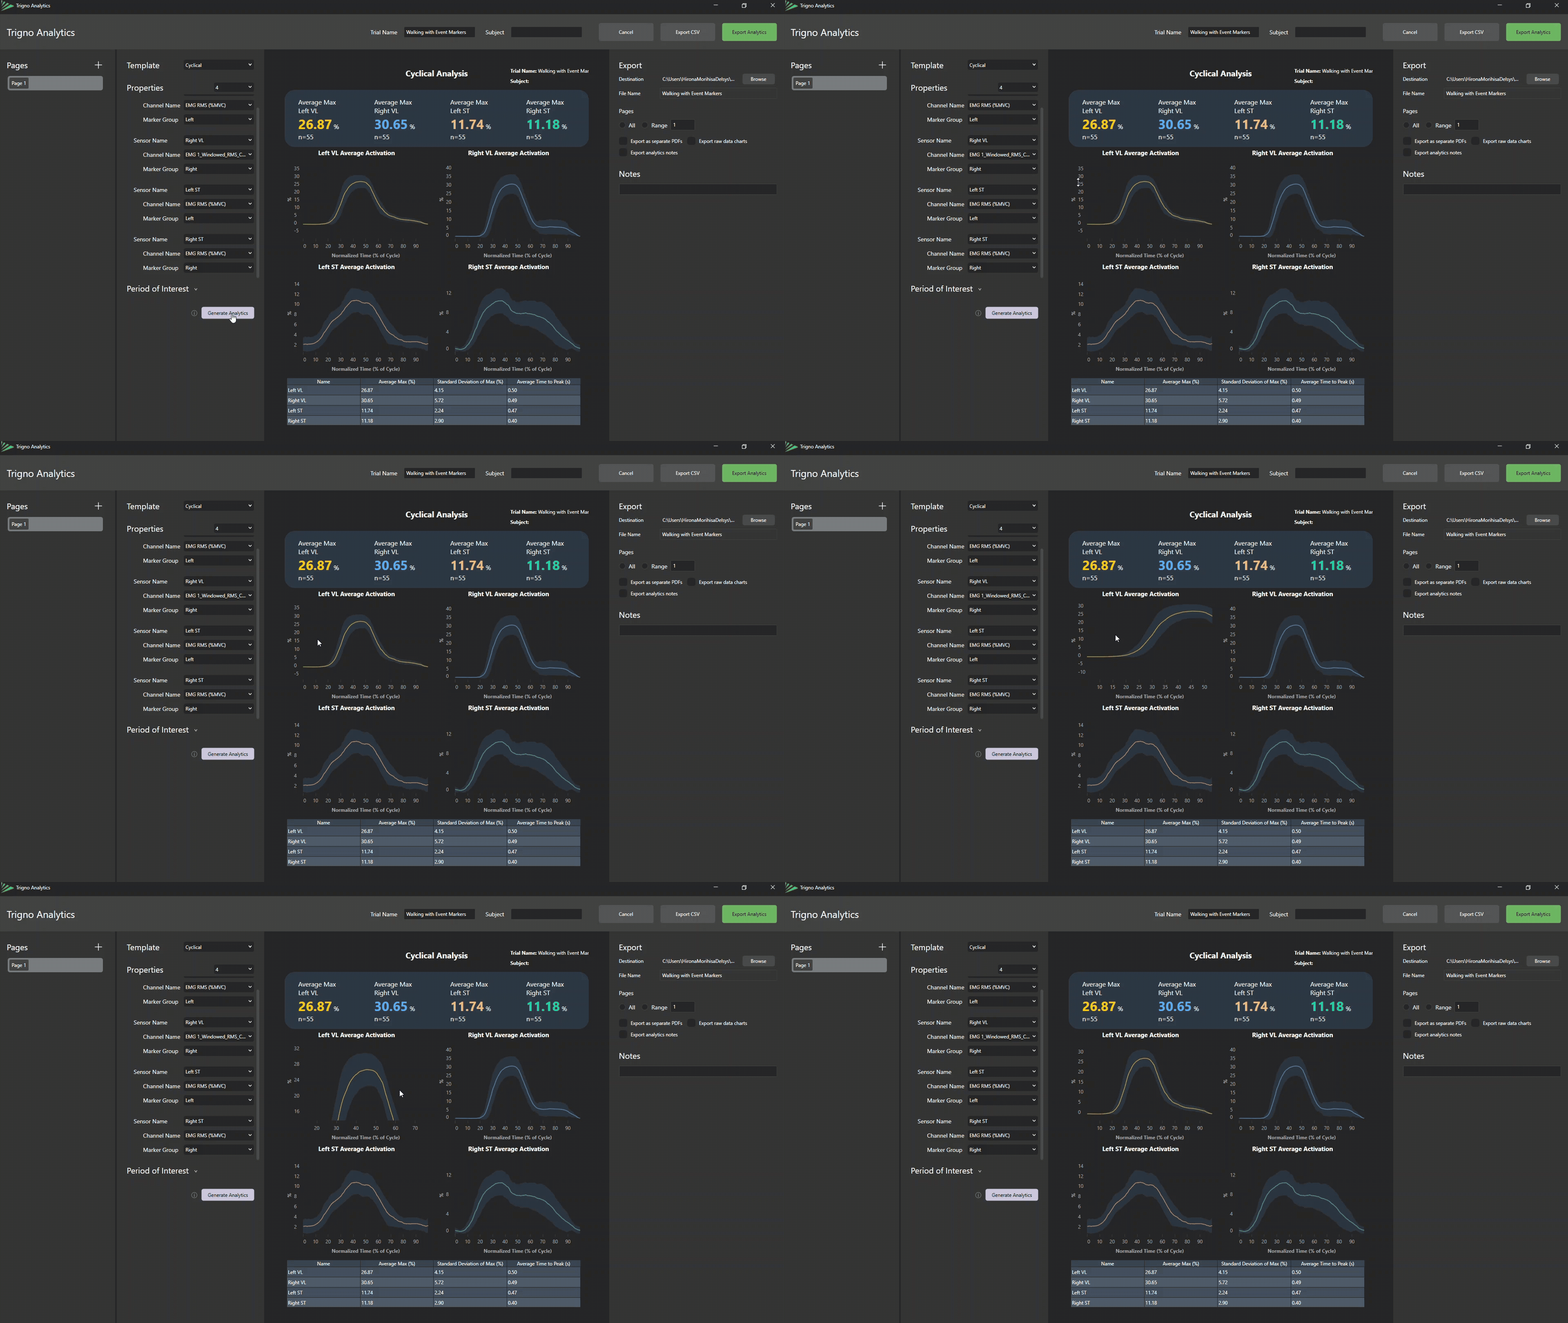
X and Y axes can be scaled:
Scaling X-axis: To scale the X-axis on the Average Activation graph, scroll the mouse wheel on the graph.
Scaling Y-axis: To scale the Y-axis, select the axis and drag up or down.
Shifting Y-axis: To shift the Y-axis position, click on the graph and drag upward or downward.
Revert to Original Scale: Double-click anywhere on the graph to revert both the X- and Y-axis to the default scale.
Zoom In: To zoom in on a specific portion of the data, right-click on the graph and highlight the desired region.
Step 7: Page Configuration
Adding/Deleting a Page
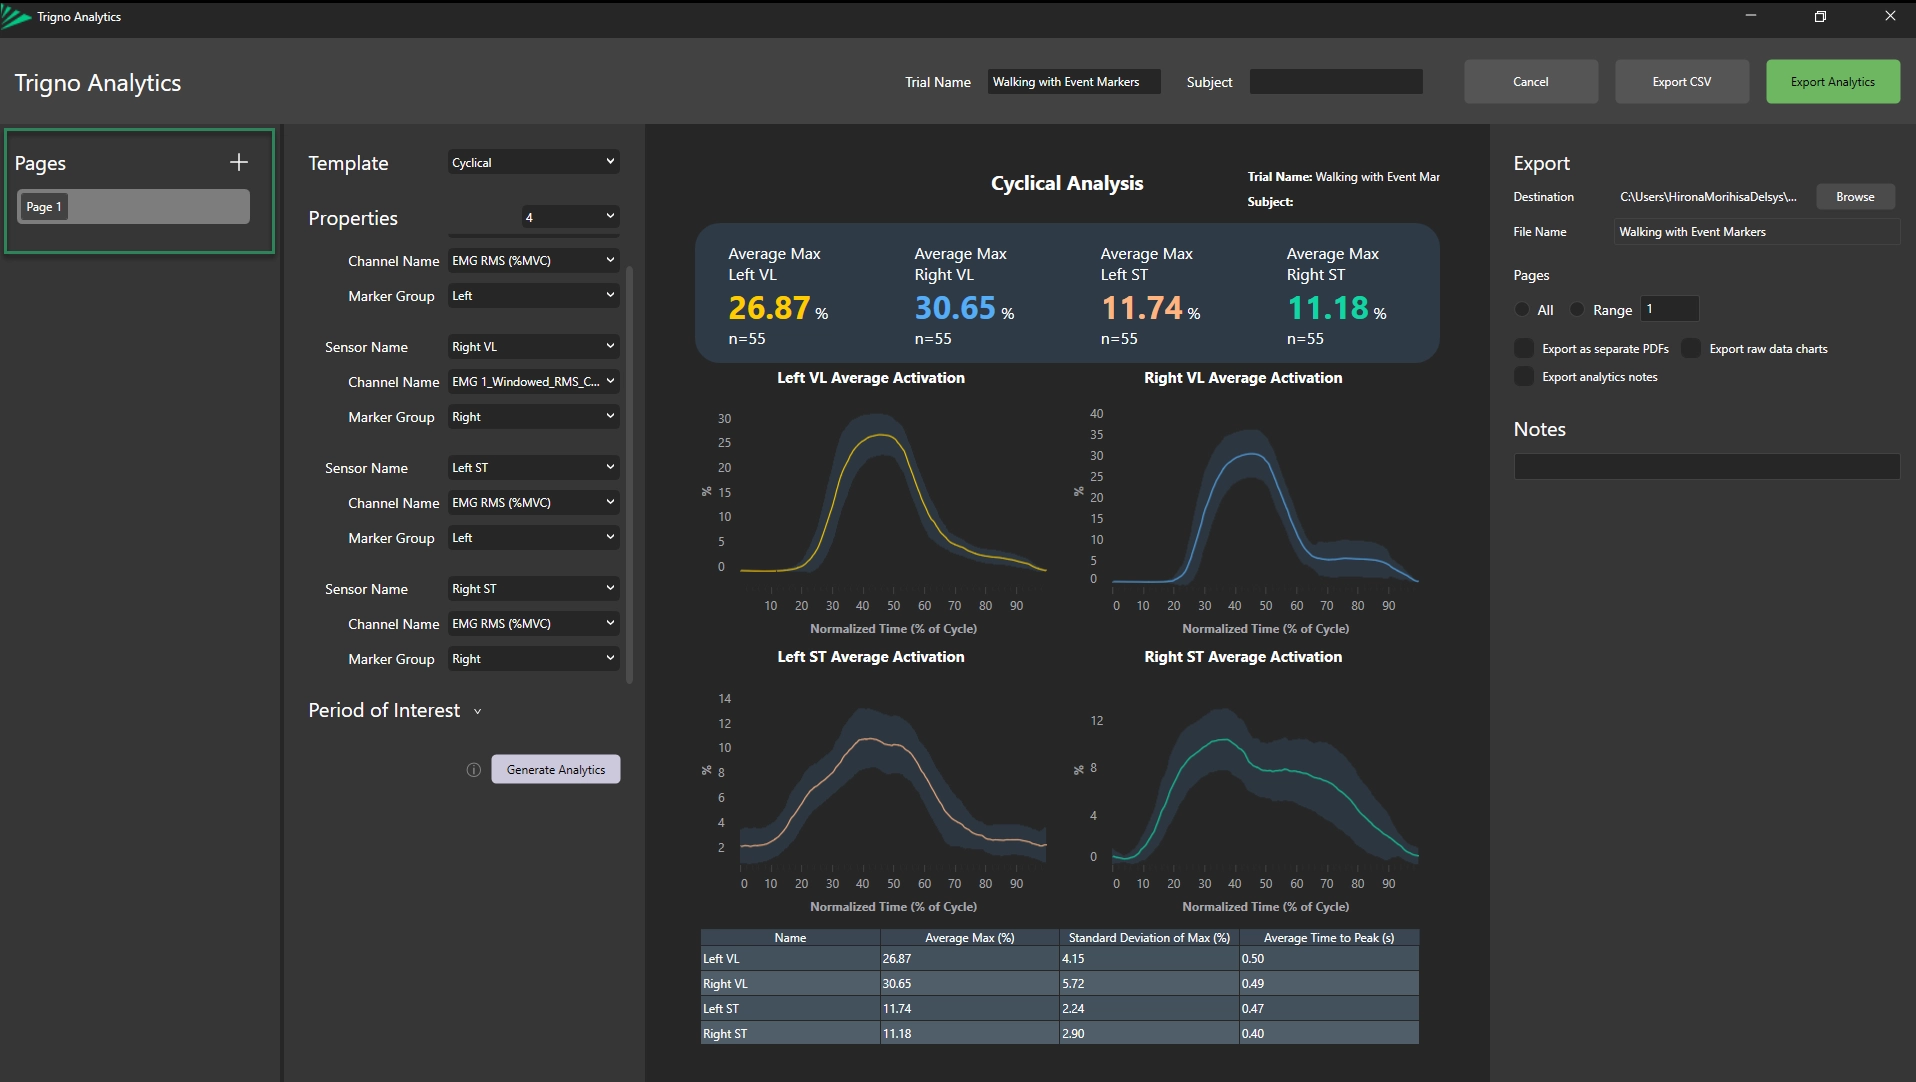
Click the “+” button to add additional pages and create more reports within the same project.
To delete a page, right-click on the page and select “Delete Page”.
Renaming Pages
Rename a page by selecting its title under Pages and entering a new name.
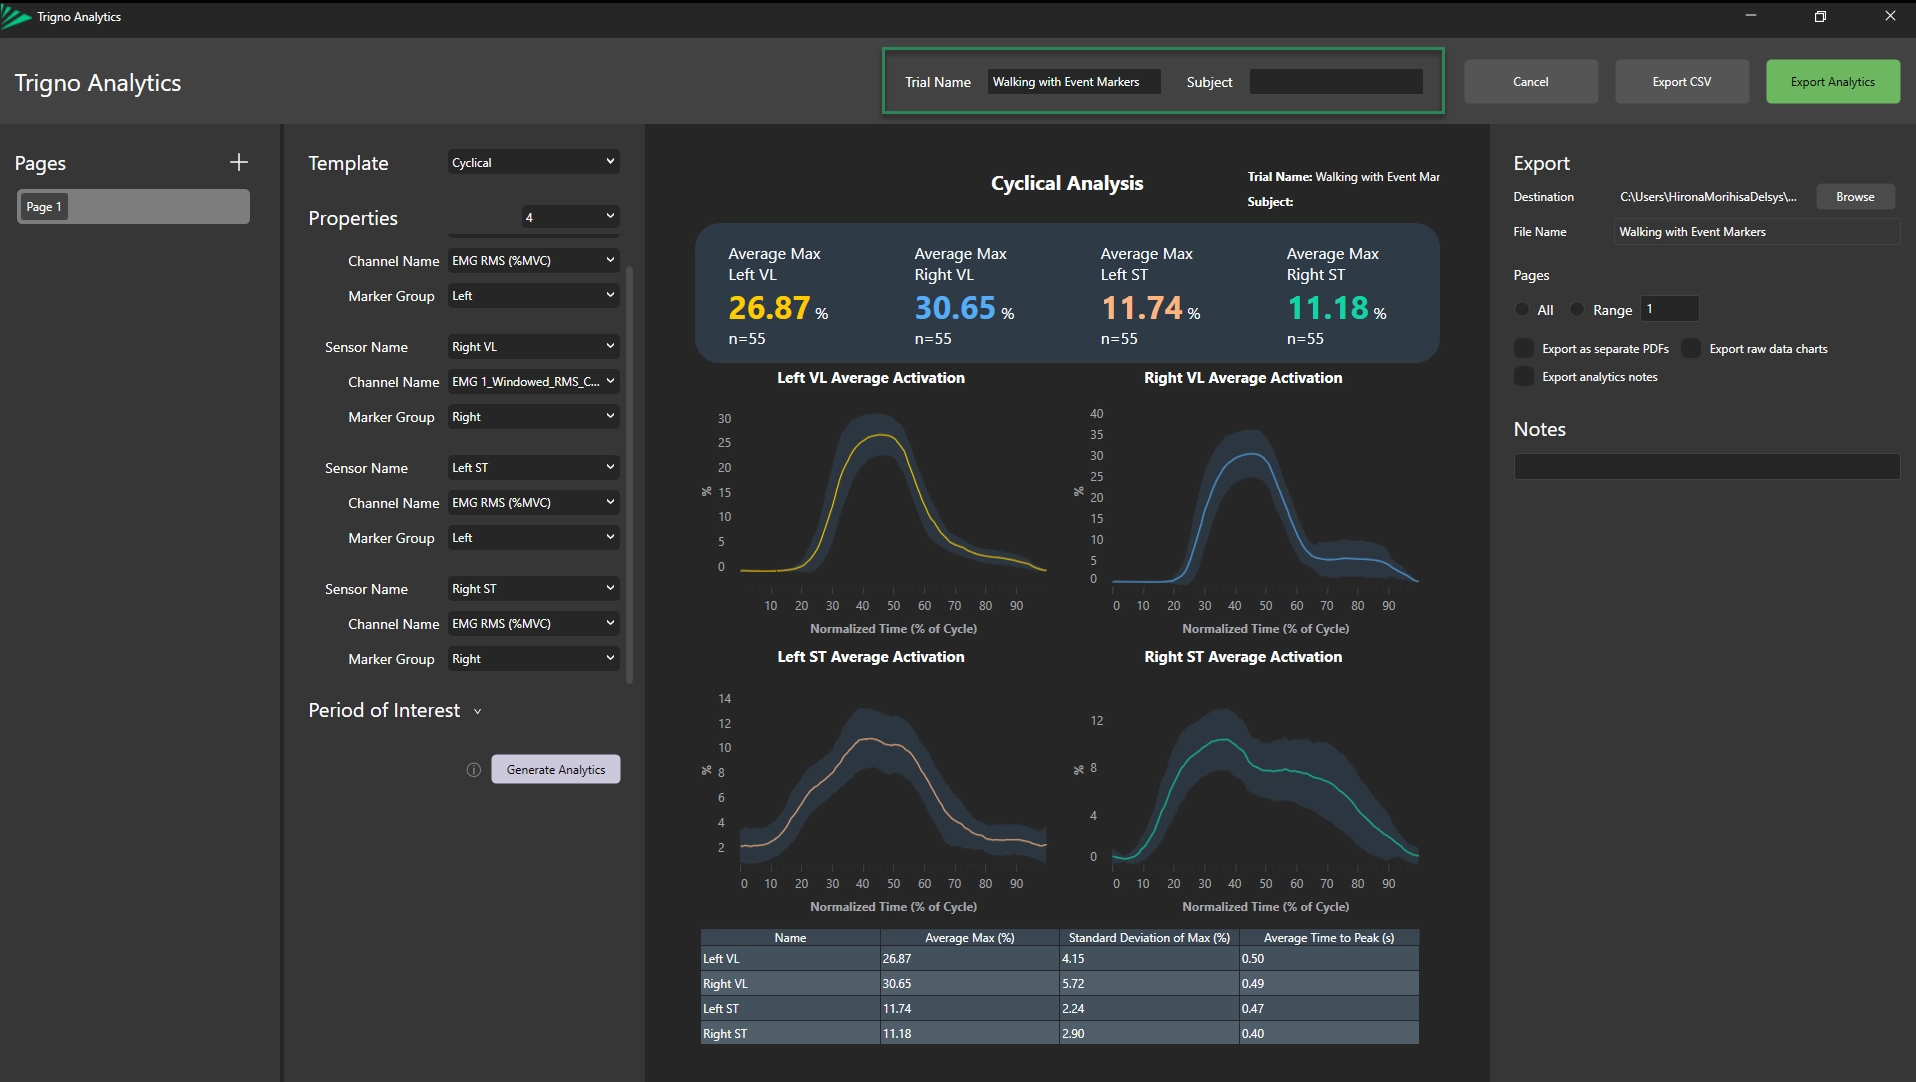
Renaming Trial and Subject
Trial and Subject can be named at the top of the screen.
Click Generate Analytics to transfer the new name to the current page.
Important
Re-selecting the Generate Analytics button will refresh the reports to reflect changes made in Trigno Analytics.
Step 8: Export the Report
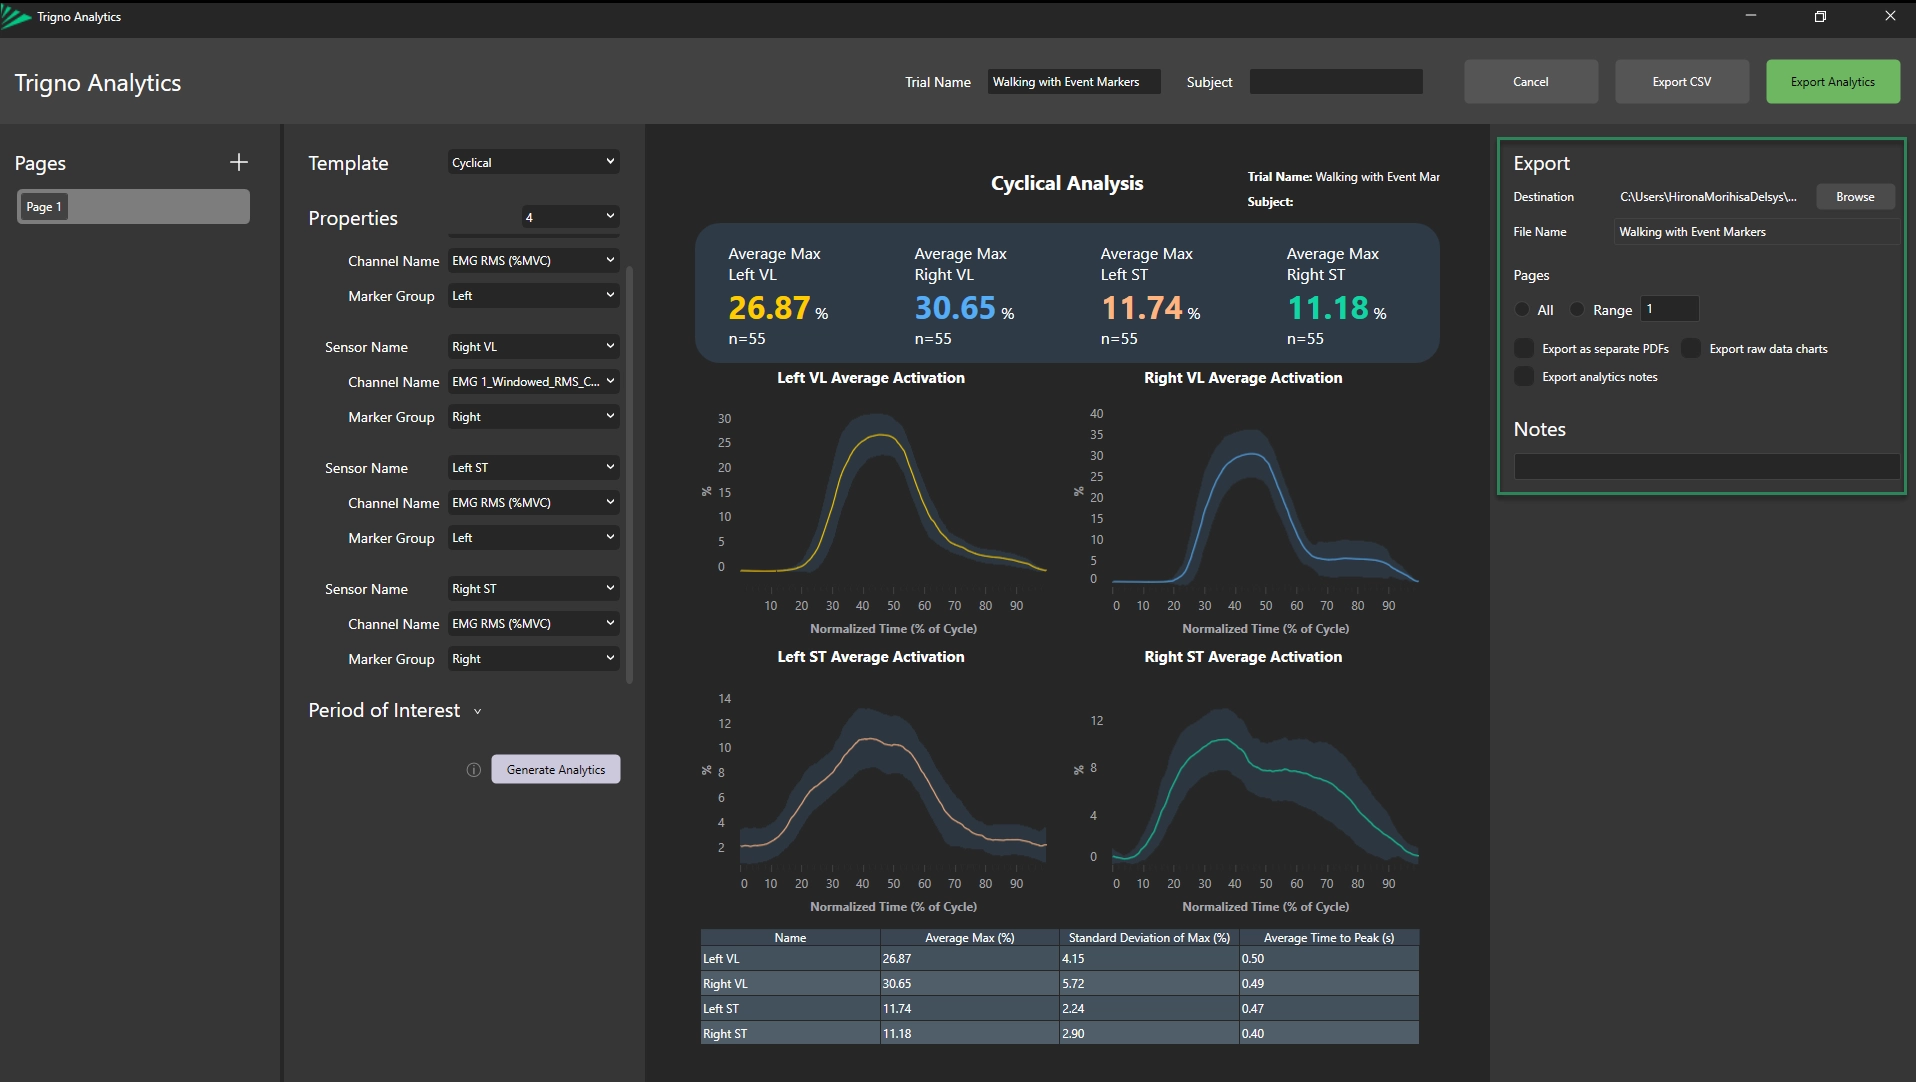
Choose File Destination and File Name
Select Browse to choose a file pathway for the saved export.
Rename the export file
Pages Export
A range of pages or all pages can be selected for export.
Selecting Export As Separate PDFs exports each page as an individual PDF file.
Selecting Export Analytics Notes includes that section in the exported file.
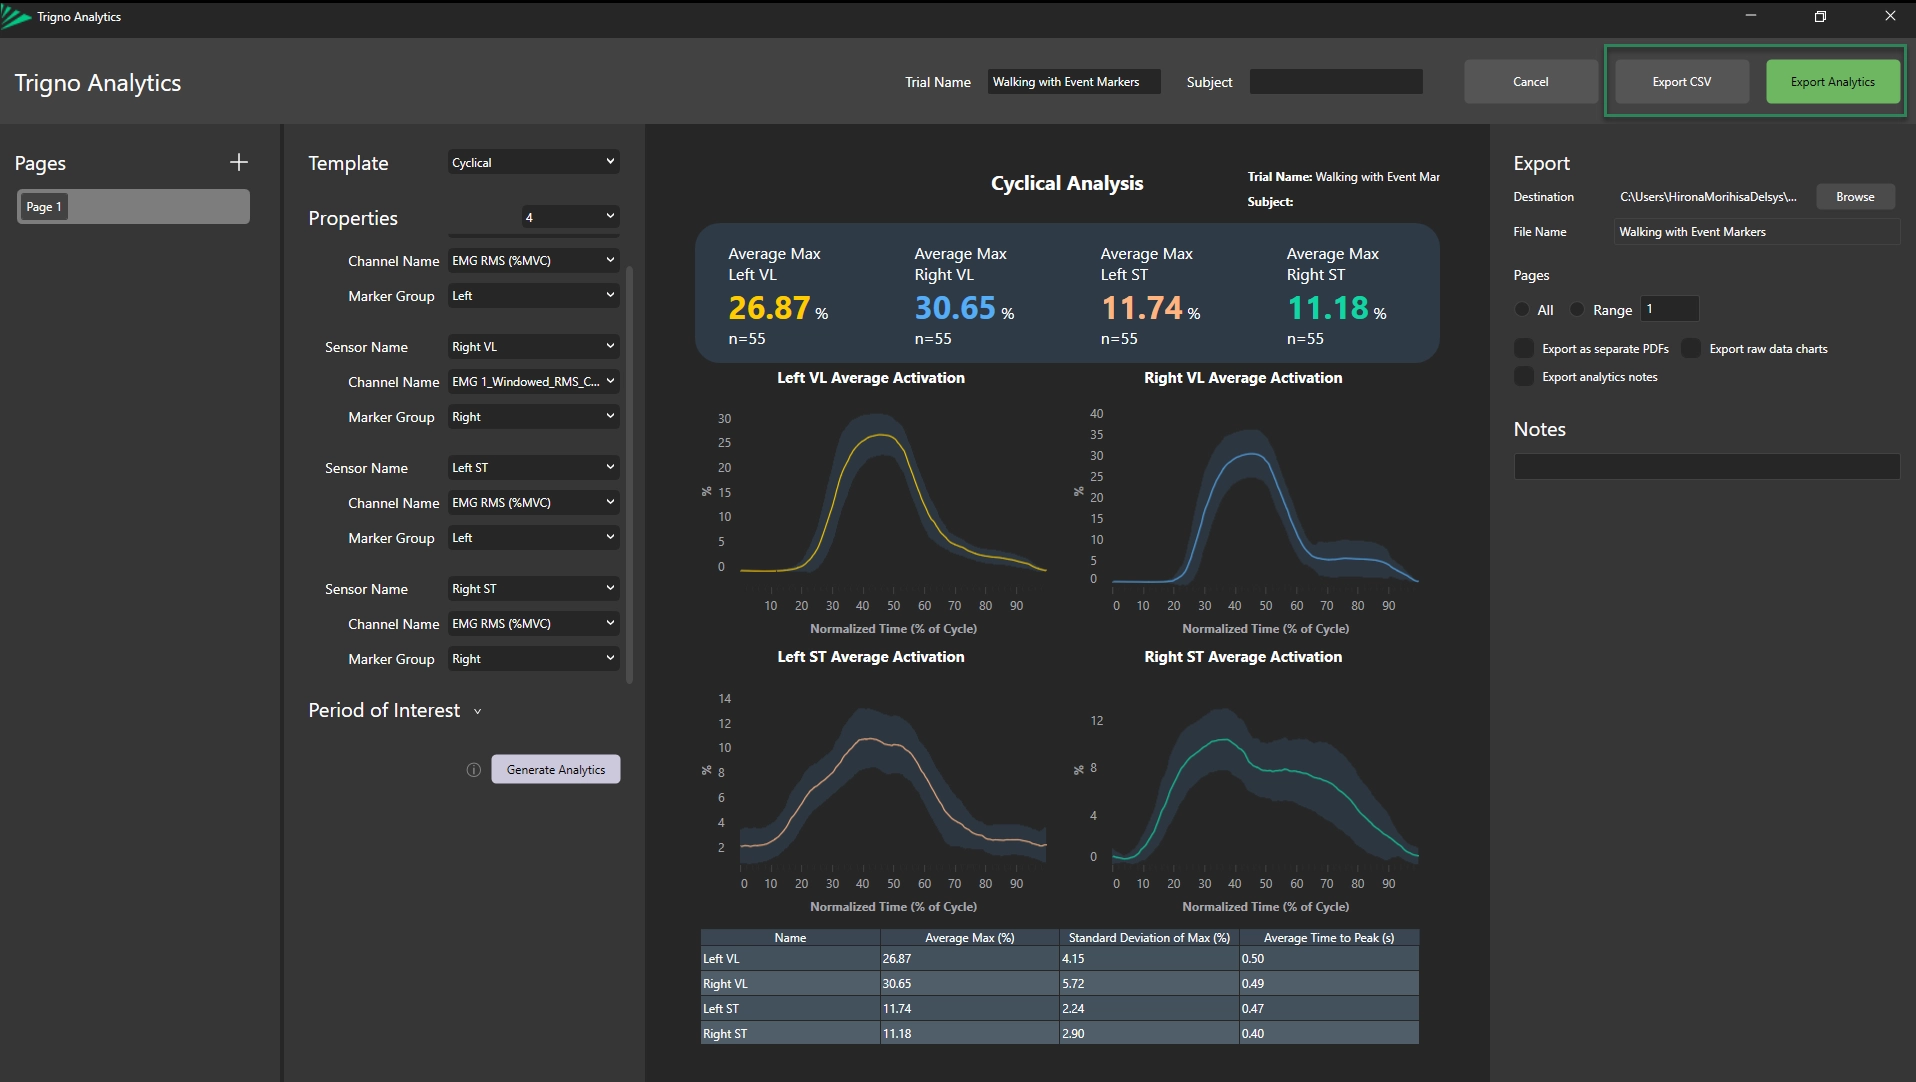
Once you are satisfied with your report, click either Export CSV or Export Analytics to begin exporting your data.
Once the export is complete, a confirmation message will appear.
Please refer to the following pages for more specific information on how to create different types of Analytics reports:
This workflow provides a recommended protocol for generating an Cyclical analysis; however, you are free to adapt your analysis in any manner that best suits your needs or preferences.
DOC-674-1-0
